How to get the most out of OP3’s free podcast analytics

OP3 is a free, privacy-aware and open-source podcast analytics service (which Podnews is a corporate sponsor of).
Once you’ve set up your podcast, you get public stats pages like this, and you get a ton of useful stats that you can compare alongside your podcast host’s stats.
But - at the bottom of the page, OP3 has an “export” function, which allows you to download monthly files containing the full details of every podcast download you’ve had. Which allows you to answer questions that you’ve never been able to answer just using your podcast host.
Get set up
You’ve access to the last two calendar months of stats in OP3. Find the box marked “Export download details” at the bottom of the page.
Because we’re writing this in November 2025, we’ll grab the stats for October 2025 for the Podnews Weekly Review, from the show’s open OP3 page by hitting “Oct 2025”. The system will prepare a TSV file for you and download it.
Next, let’s open a spreadsheet program. We’ll use Google Sheets, because everyone has access to that.
- Hit the button marked “Start a new spreadsheet”
- Choose “File > Import” and upload the TSV file you just downloaded
- Leave the defaults and hit “Import Data”
You should end up with something looking like this:
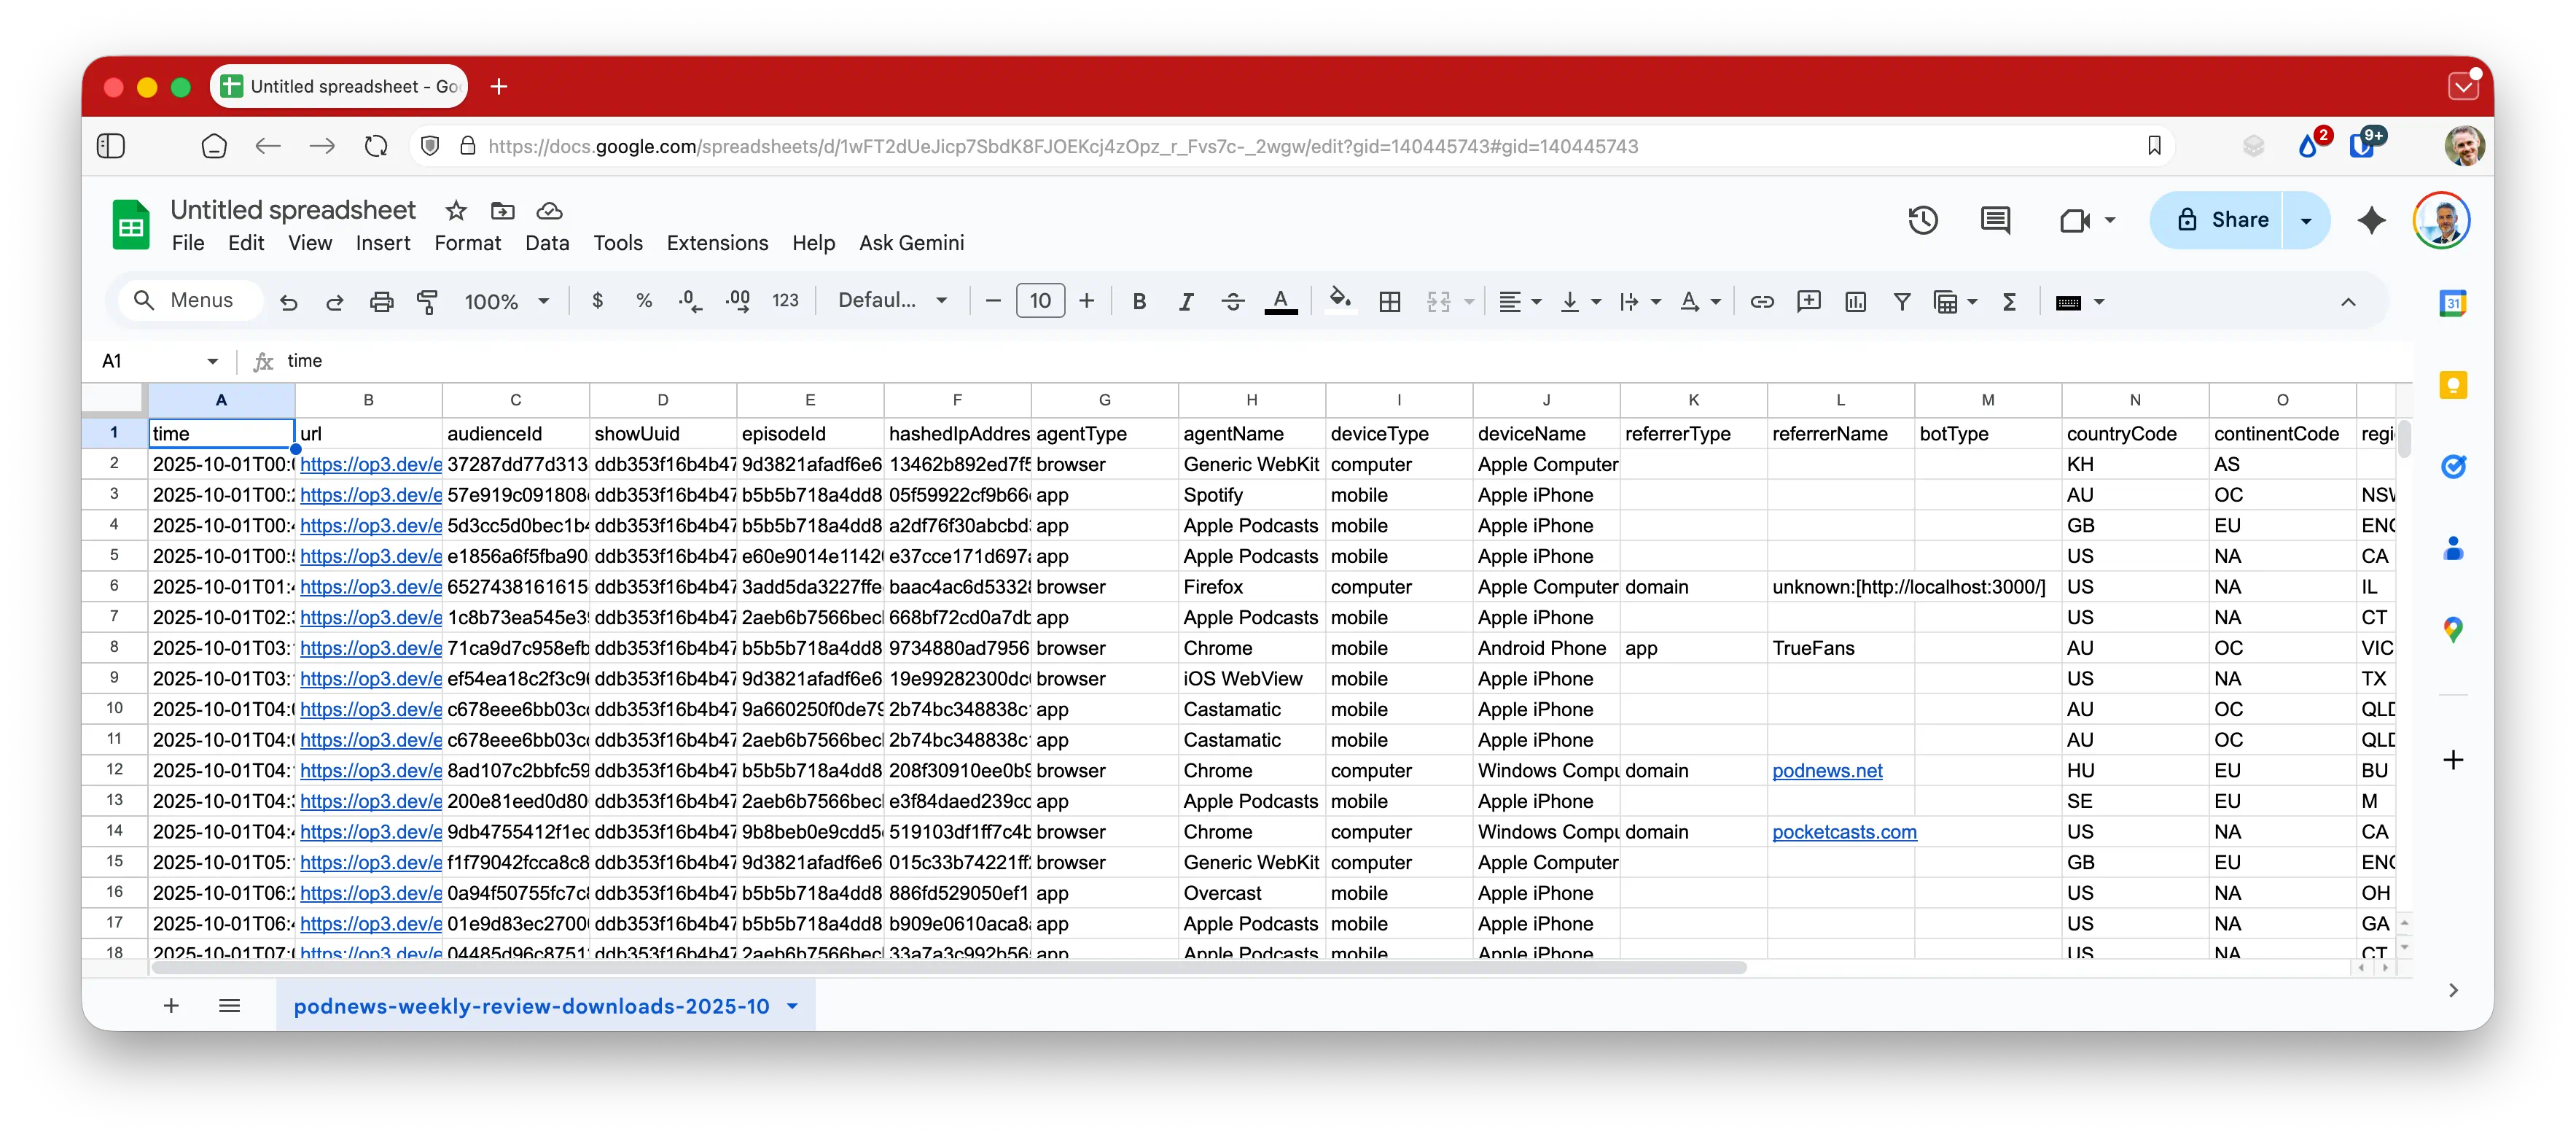
There’s one line for every single download our podcast got in October.
And with this… we can have some fun.
What are the top apps by download different countries?
OP3 tells you the apps that all your listeners are using. In our case, Apple Podcasts is #1 with 64%. But - 3.1% of our plays are from Japan. What is the most popular app in Japan for our podcast?
We’re going to use a pivot table to help us here.
- Choose “Insert > Pivot Table”
- Leave the default for a new sheet
- Hit “Create”
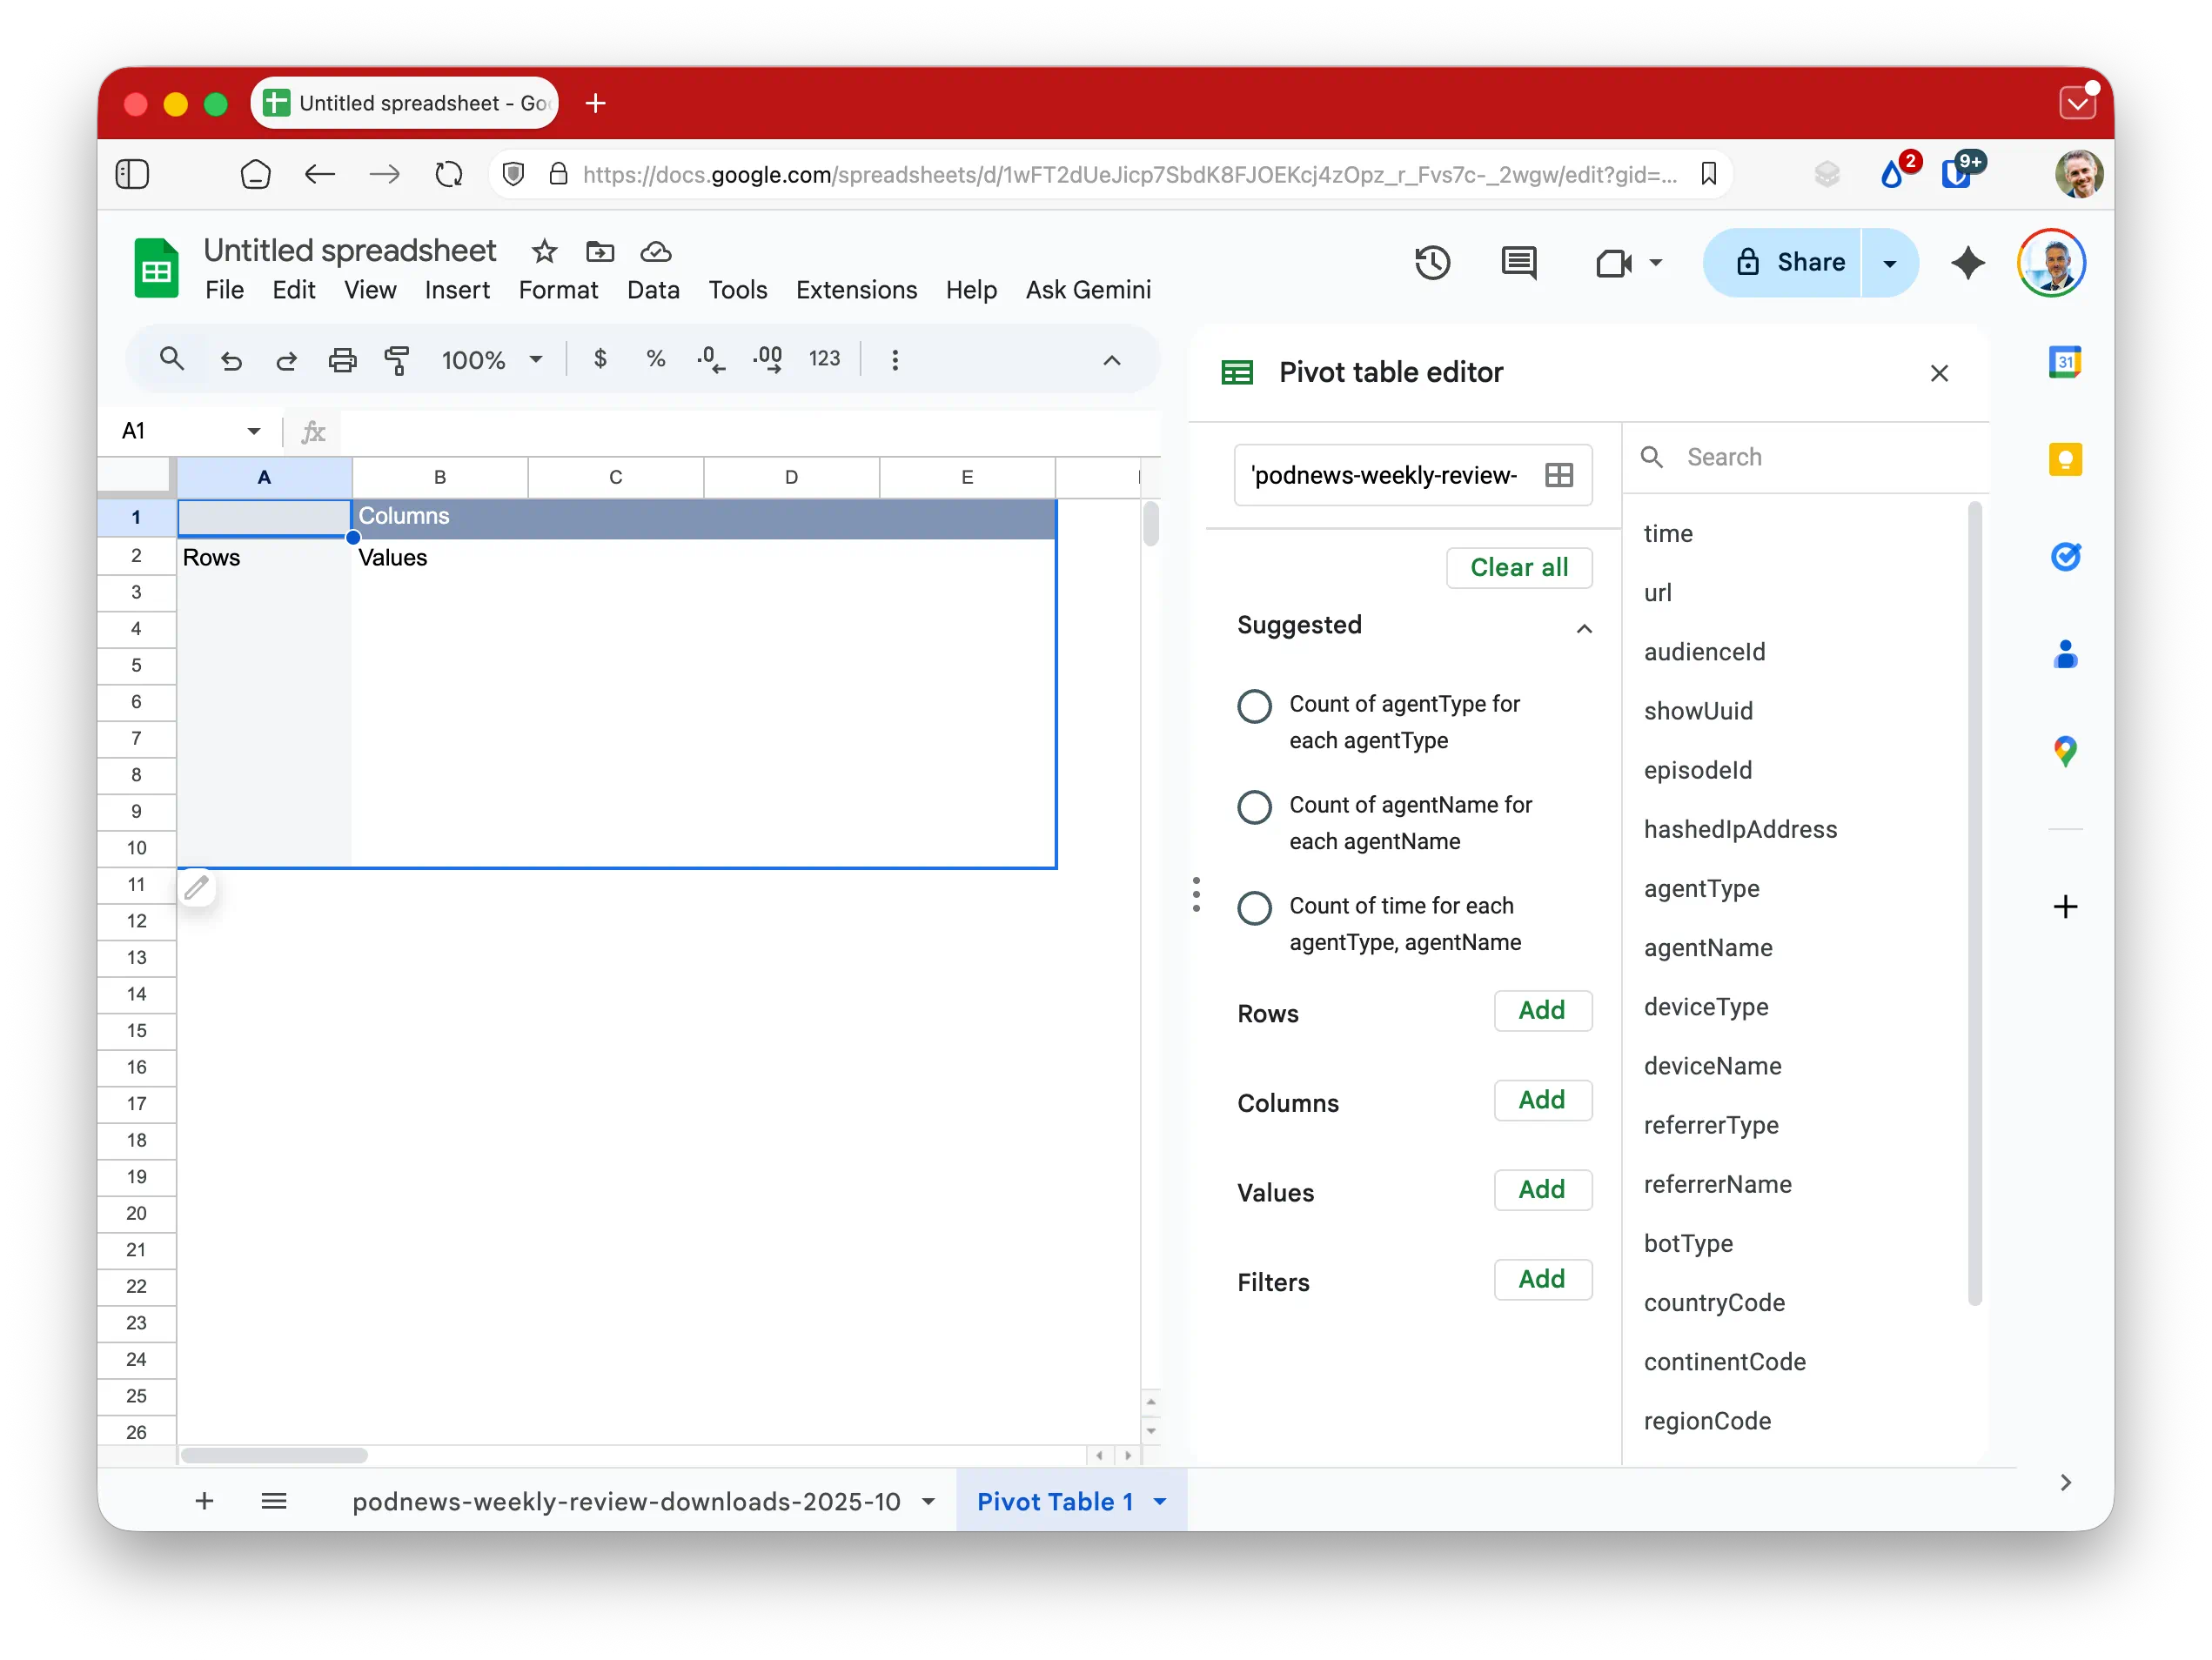
OK, you should now have a screen looking like this.
What apps are downloading each show?
In OP3, the name of an app is called an agentName. We’d quite like to see the total number of downloads for each agentName, one per row.
Get one row per agent name in the pivot table editor, by hitting “ADD” next to “row”, and choose agentName.
Then, get total numbers for each agent name in the pivot table editor, by adding “ADD” next to “Values”, and choose agentName.
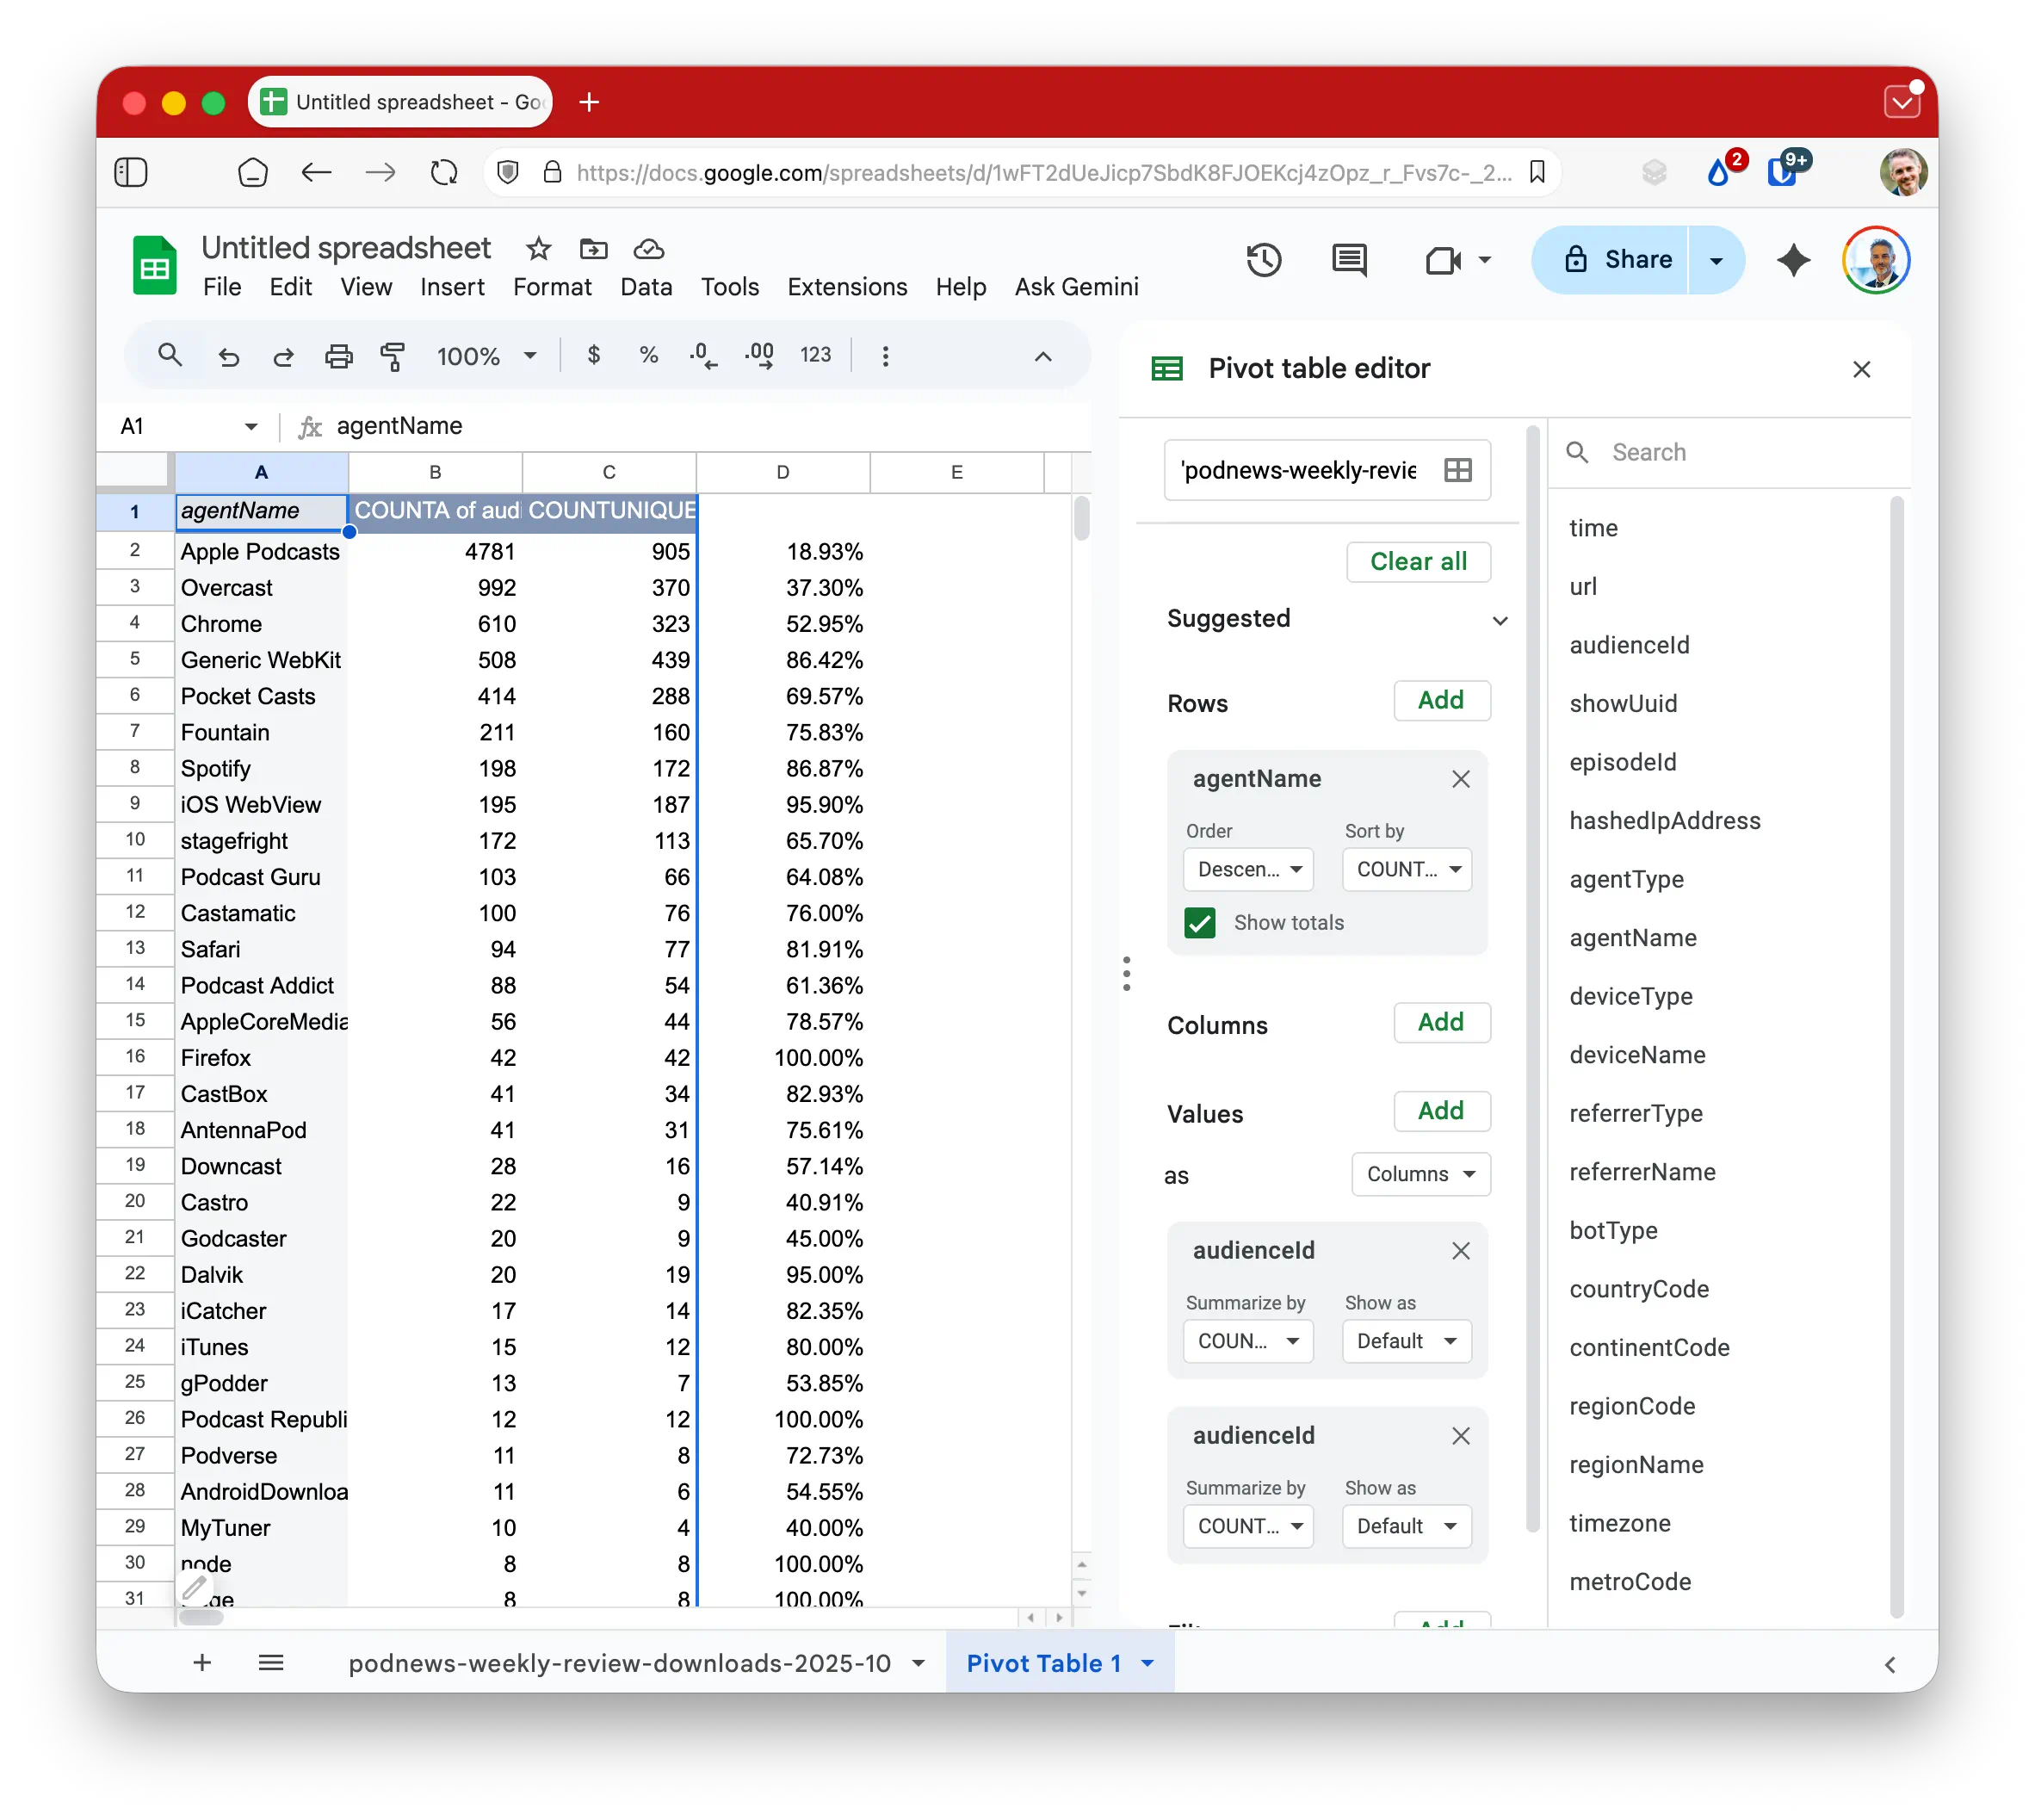
The result will be a list showing you a total number of downloads for each agentName, or app name.
In “Rows”, you’ll see it says “agentName Order Ascending, Sort by agentName”. Let’s change those two dropdowns to “Descending”, “COUNTA of agentName”.
Now, you’ll have something that looks like this. It’s the total downloads for this podcast, by app name.
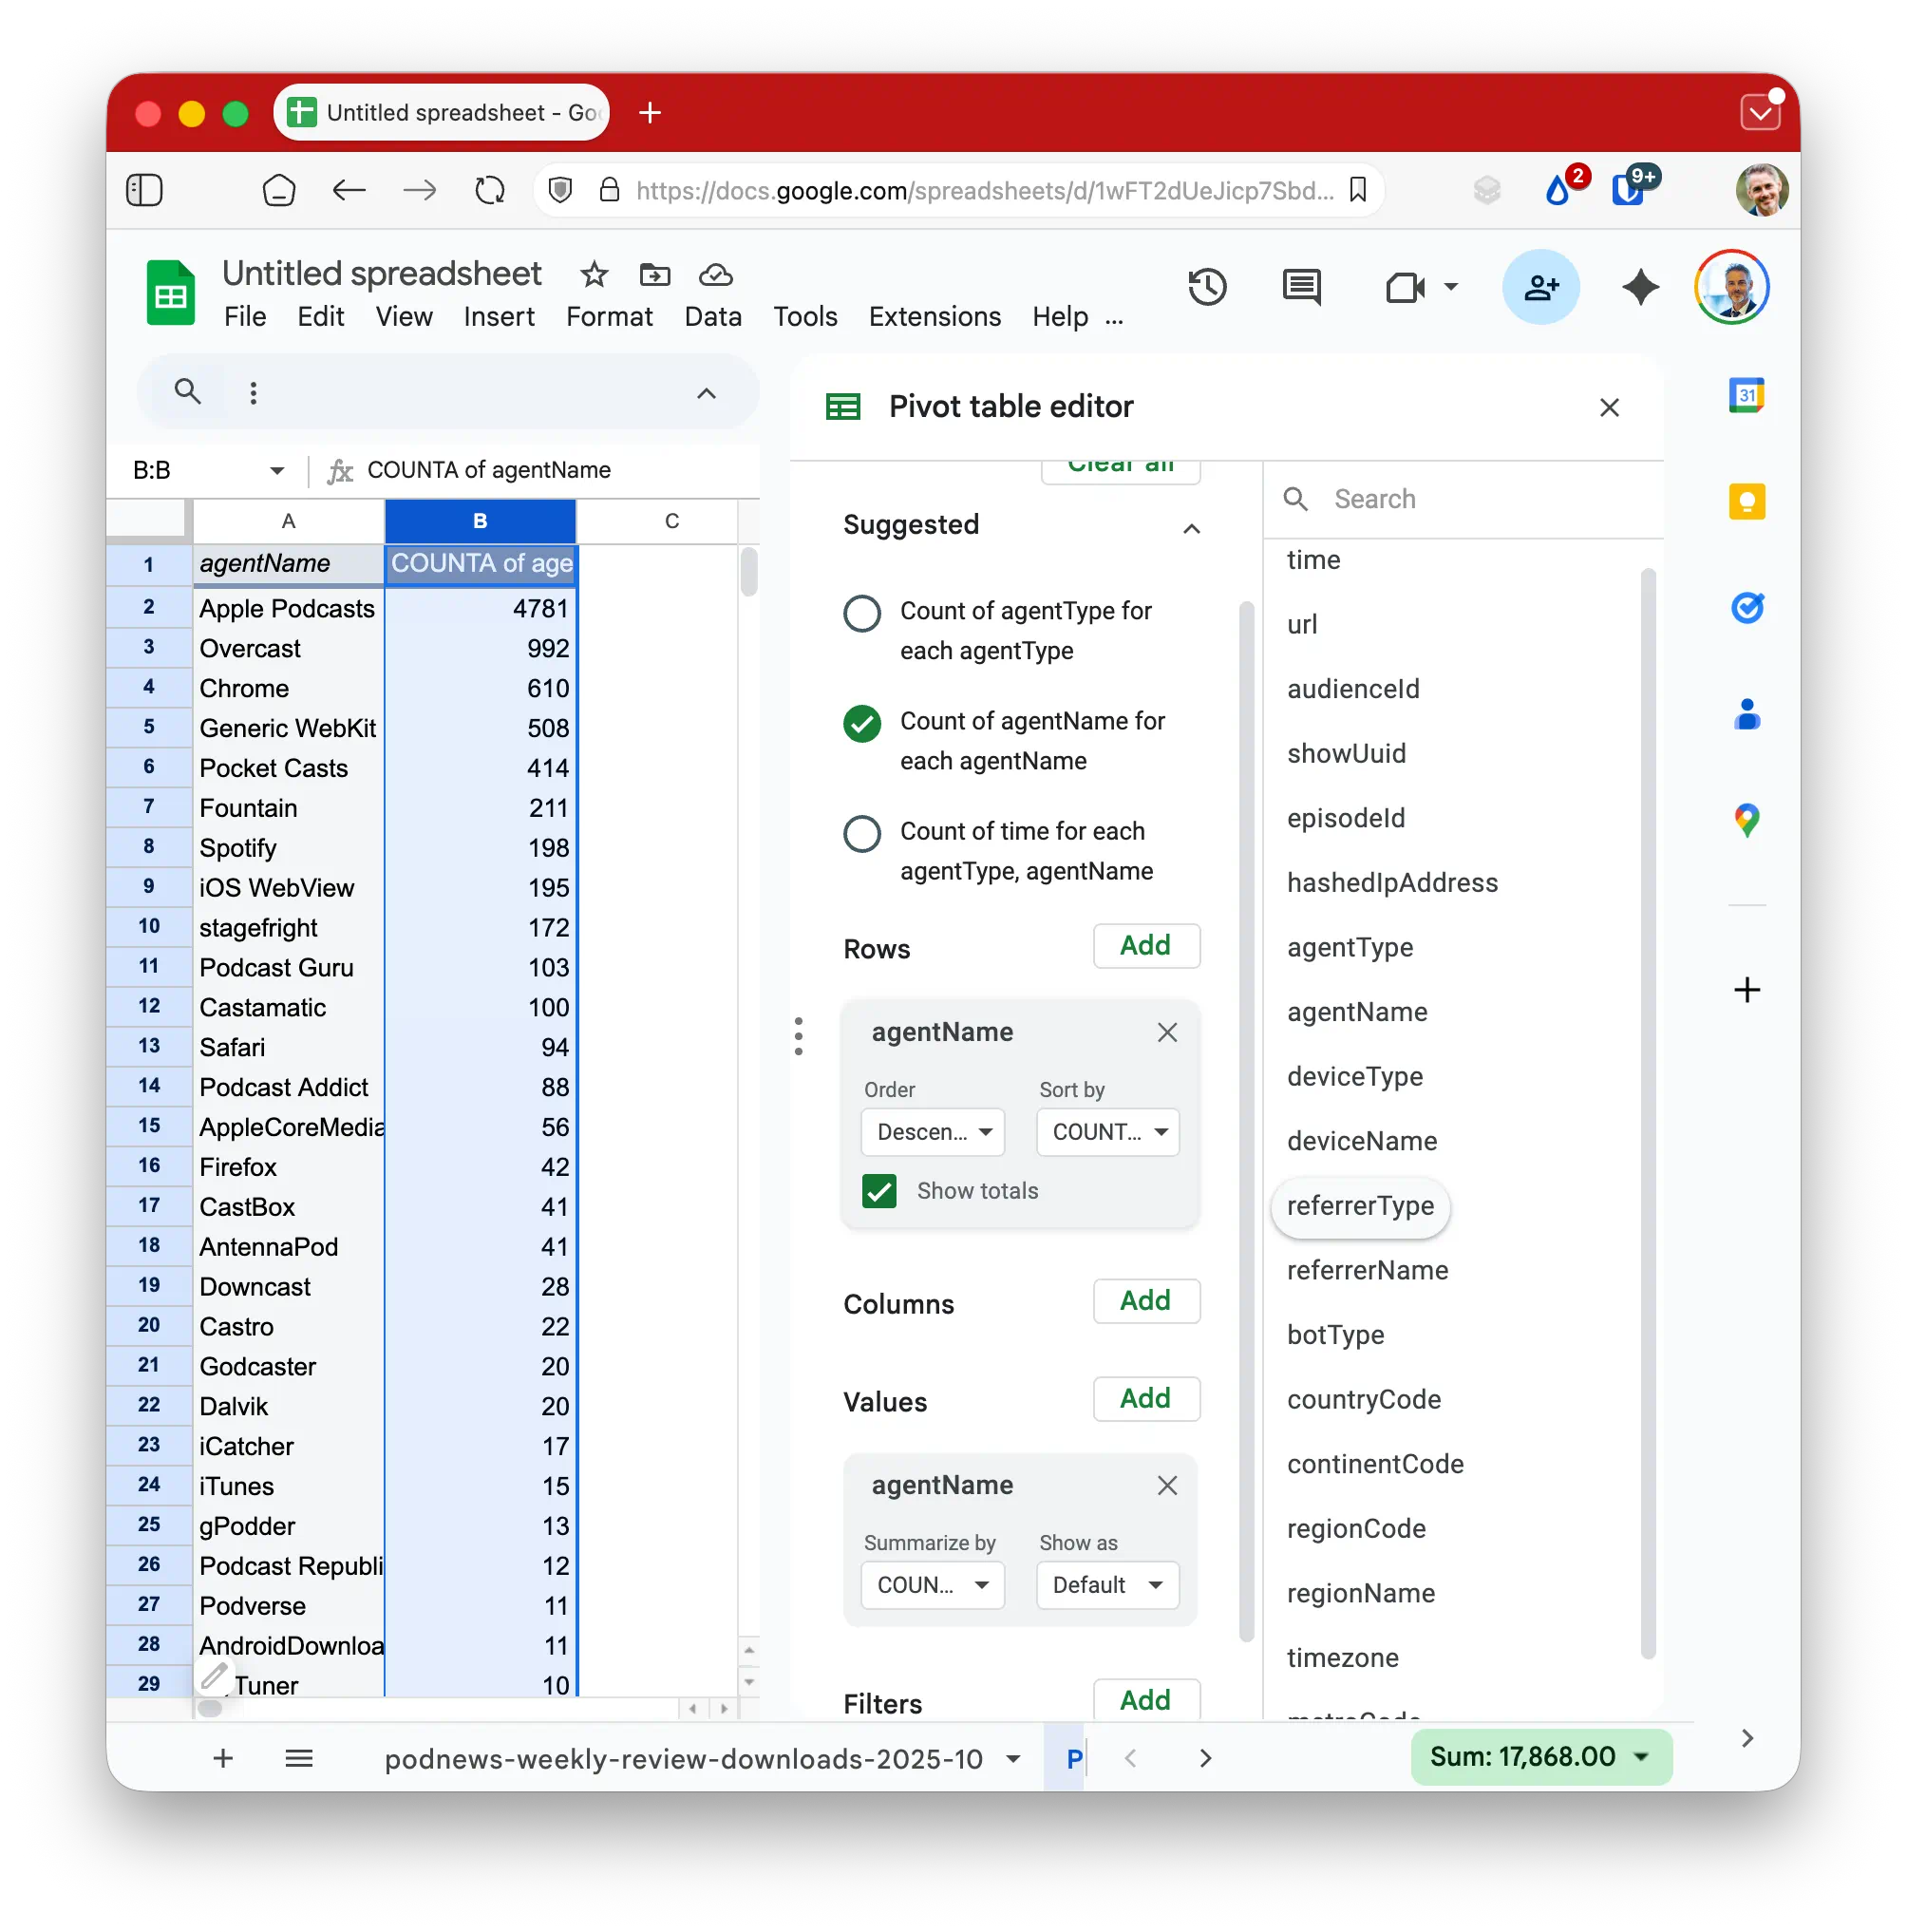
This is great: but this is nothing that you can’t get with your podcast host stats anyway.
Focus this on one episode
But - we have one episode which is showing odd numbers. What’s up with that one? Let’s filter the view to only include one episode.
To do that, go to the main sheet and find the episode URL we’ve been given. Podnews Weekly Review uses Buzzsprout, which has our episode title as the name of the MP3 file which is nice.
So, add a filter for one episode by hitting “ADD” next to “filters” and choosing url. In the drop-down box that appears, deselect every episode first, then search for the episode you want to investigate. Now, you’ll see the app download figures JUST for that episode, which most podcast hosts won’t give you.
So, we know the downloads-per-app figures for one episode. Let’s clear that (hit the “x” in the filter) and instead, let’s see those downloads-per-app figures for one country, instead. Does Japan follows the same pattern - Apple Podcasts at #1, Overcast at #2, and Chrome at #3? Let’s filter this list, just for listeners in Japan.
Add a filter for one country, by hitting “ADD” next to filters, and choosing countryCode. The code for Japan is JP.
So, scroll down the middle column to where it says “Filters”, and hit the “add” button. Choose “countryCode”, and change the dropdown from “show all items” to just “JP”.
We’re given total downloads, by app, in Japan only.
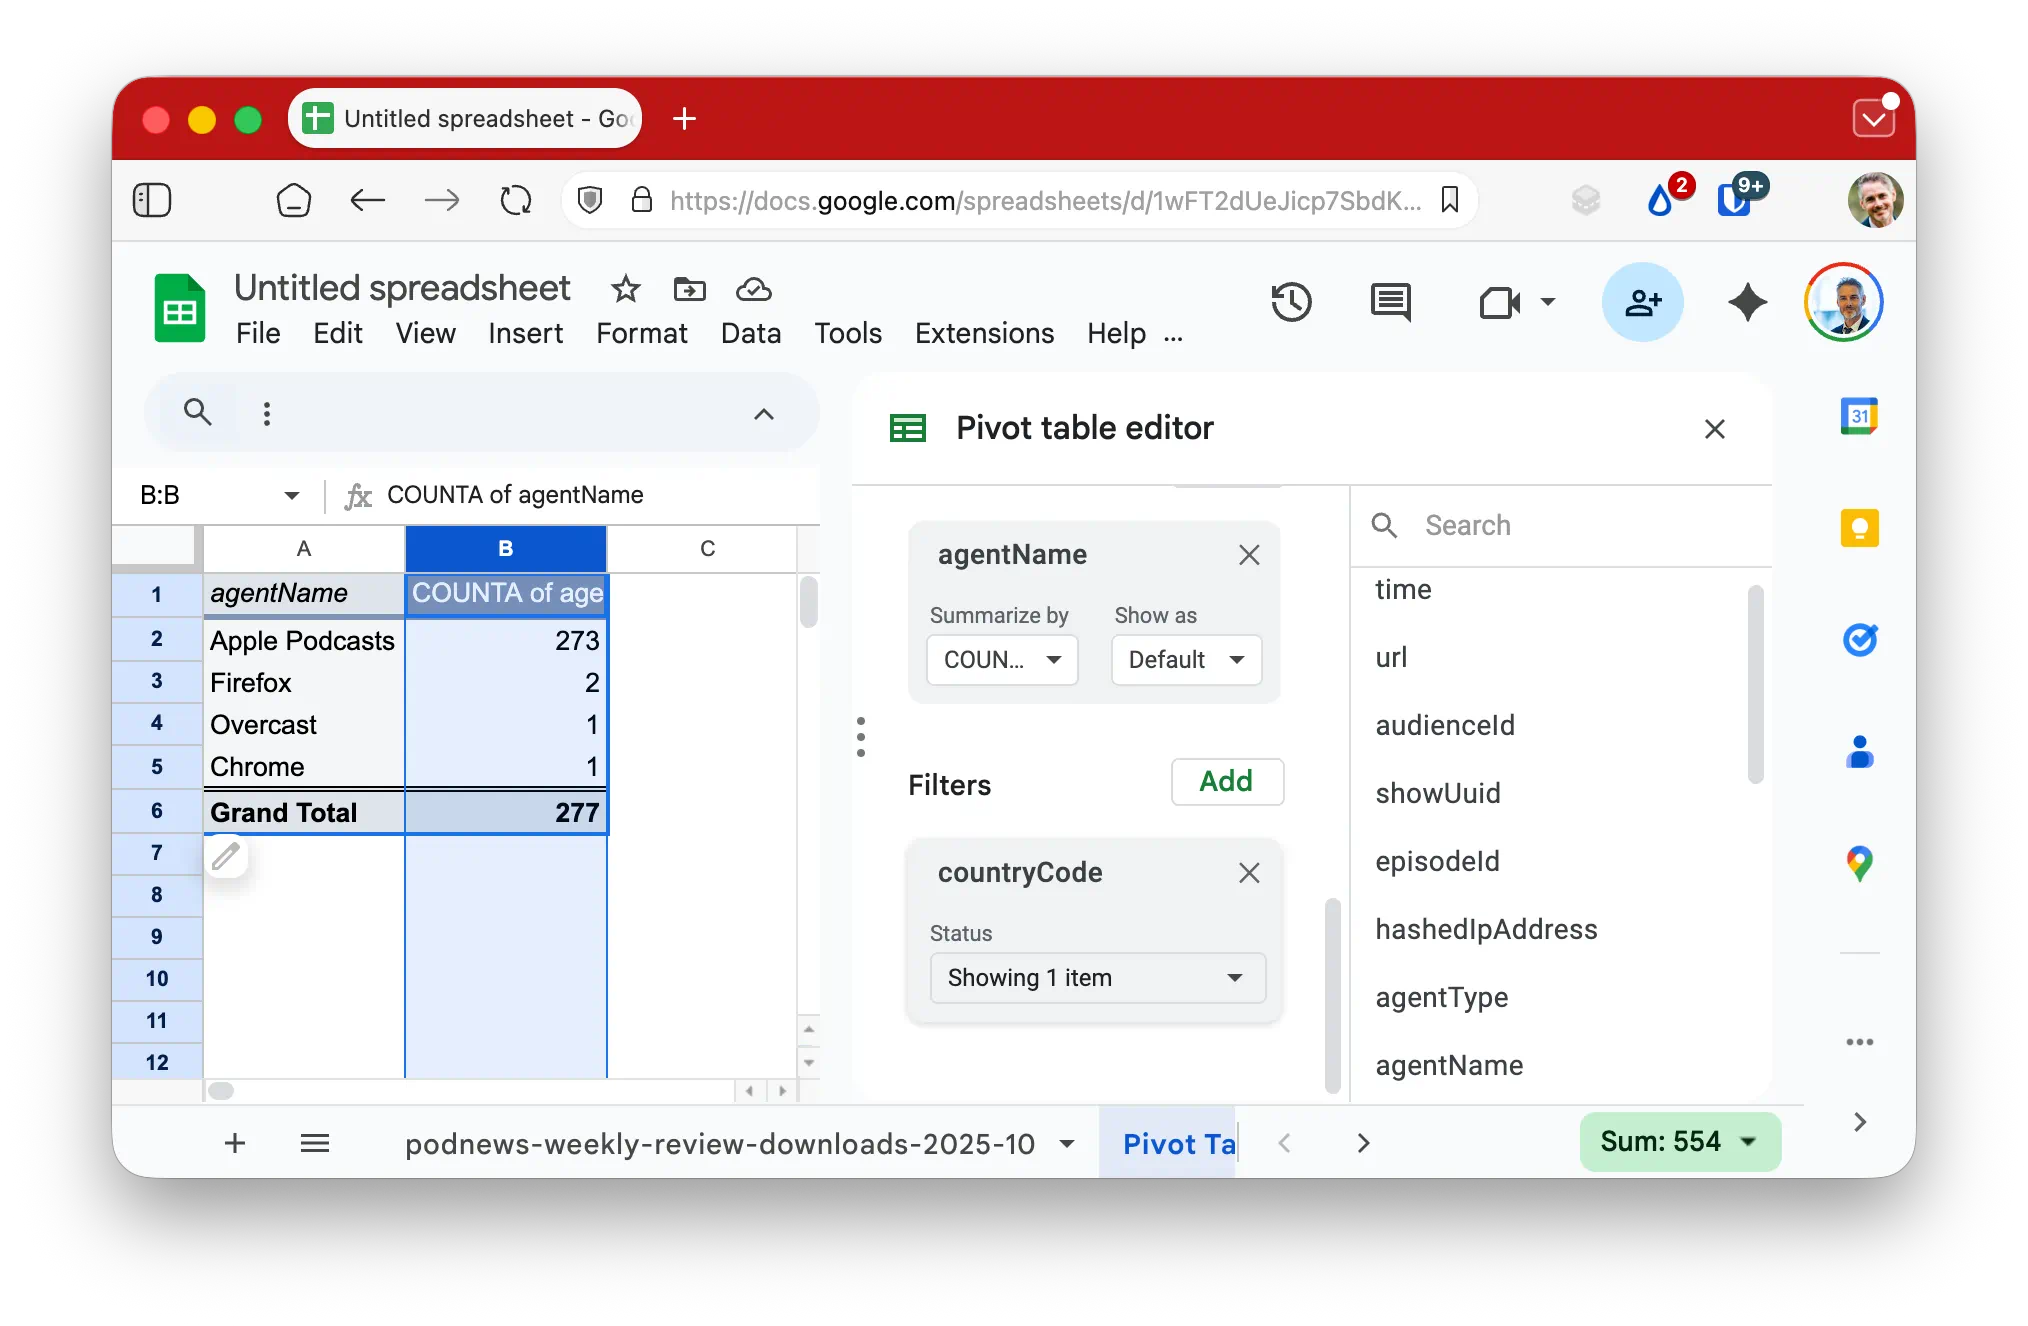
Overcast isn’t used much - by our Japanese listeners at least - and it’s really only Firefox, Overcast and Chrome. Try getting that from your podcast host!
Listeners vs downloads - by app
OP3 has a thing called an audienceID, which is calculated like the IAB calculates a “listener” - it’s a hash of a users’ IP address and their useragent. These hashes change monthly for privacy; but for many listeners, that data won’t change throughout the month.
“COUNTA” will just count them, and since every download has an audienceID, it’ll show the total downloads.
But, “COUNTUNIQUE” will count unique ones - every individual “listener”.
A little fiddling with the pivot table allows us to see all apps, and how many unique audienceIDs they have as a percentage of all downloads.
Here’s what we can see - Apple Podcasts users are, likely, mostly subscribed to the show and download each episode automatically: each listener is downloading about five episodes each. (Auto-downloading normally happens overnight while your phone charges, connected to wifi)
Pocket Casts figures are quite different: listeners using that are only consuming one or two episodes. It might be because Pocket Casts “streams” on demand, rather than download, so listening is more likely to be away from home. Or it might be because we have fewer people subscribed.
(In reality, even if the IAB calls these figures “listeners” or “audience”, it’s really “device”.)
What time do people in California download our show?
You can see overall times of downloads in many podcast apps - but that’s not really very helpful.
Let’s pretend we’re aimed at California, and we want to work out when people are downloading our show in that state.
For this we’re going to go back to the main sheet. We’ll insert a new column in column B, type hour into B1, click into B2 and put in the formula =MID(A2,12,2) so it just pulls out the hour from the time next to it. Then fill that formula down the rest of the data (select the cell with the formula, copy it, then hold down the SHIFT + CTRL keys then hit the down arrow key, to select the remaining cells in the column, then paste.) Now we have an hour column.
Then, insert a new pivot table again. We want the rows to be hour (which is GMT); we want the values to be COUNTUNIQUE of audienceID (so we’re looking at people not downloads); and we’ll filter by regionName to “Texas”.
Finally, the “hour” column is in GMT, not California time, which is eight hours behind. You can write your own formula to add another column if you like, outside the pivot table.
We end up with this:
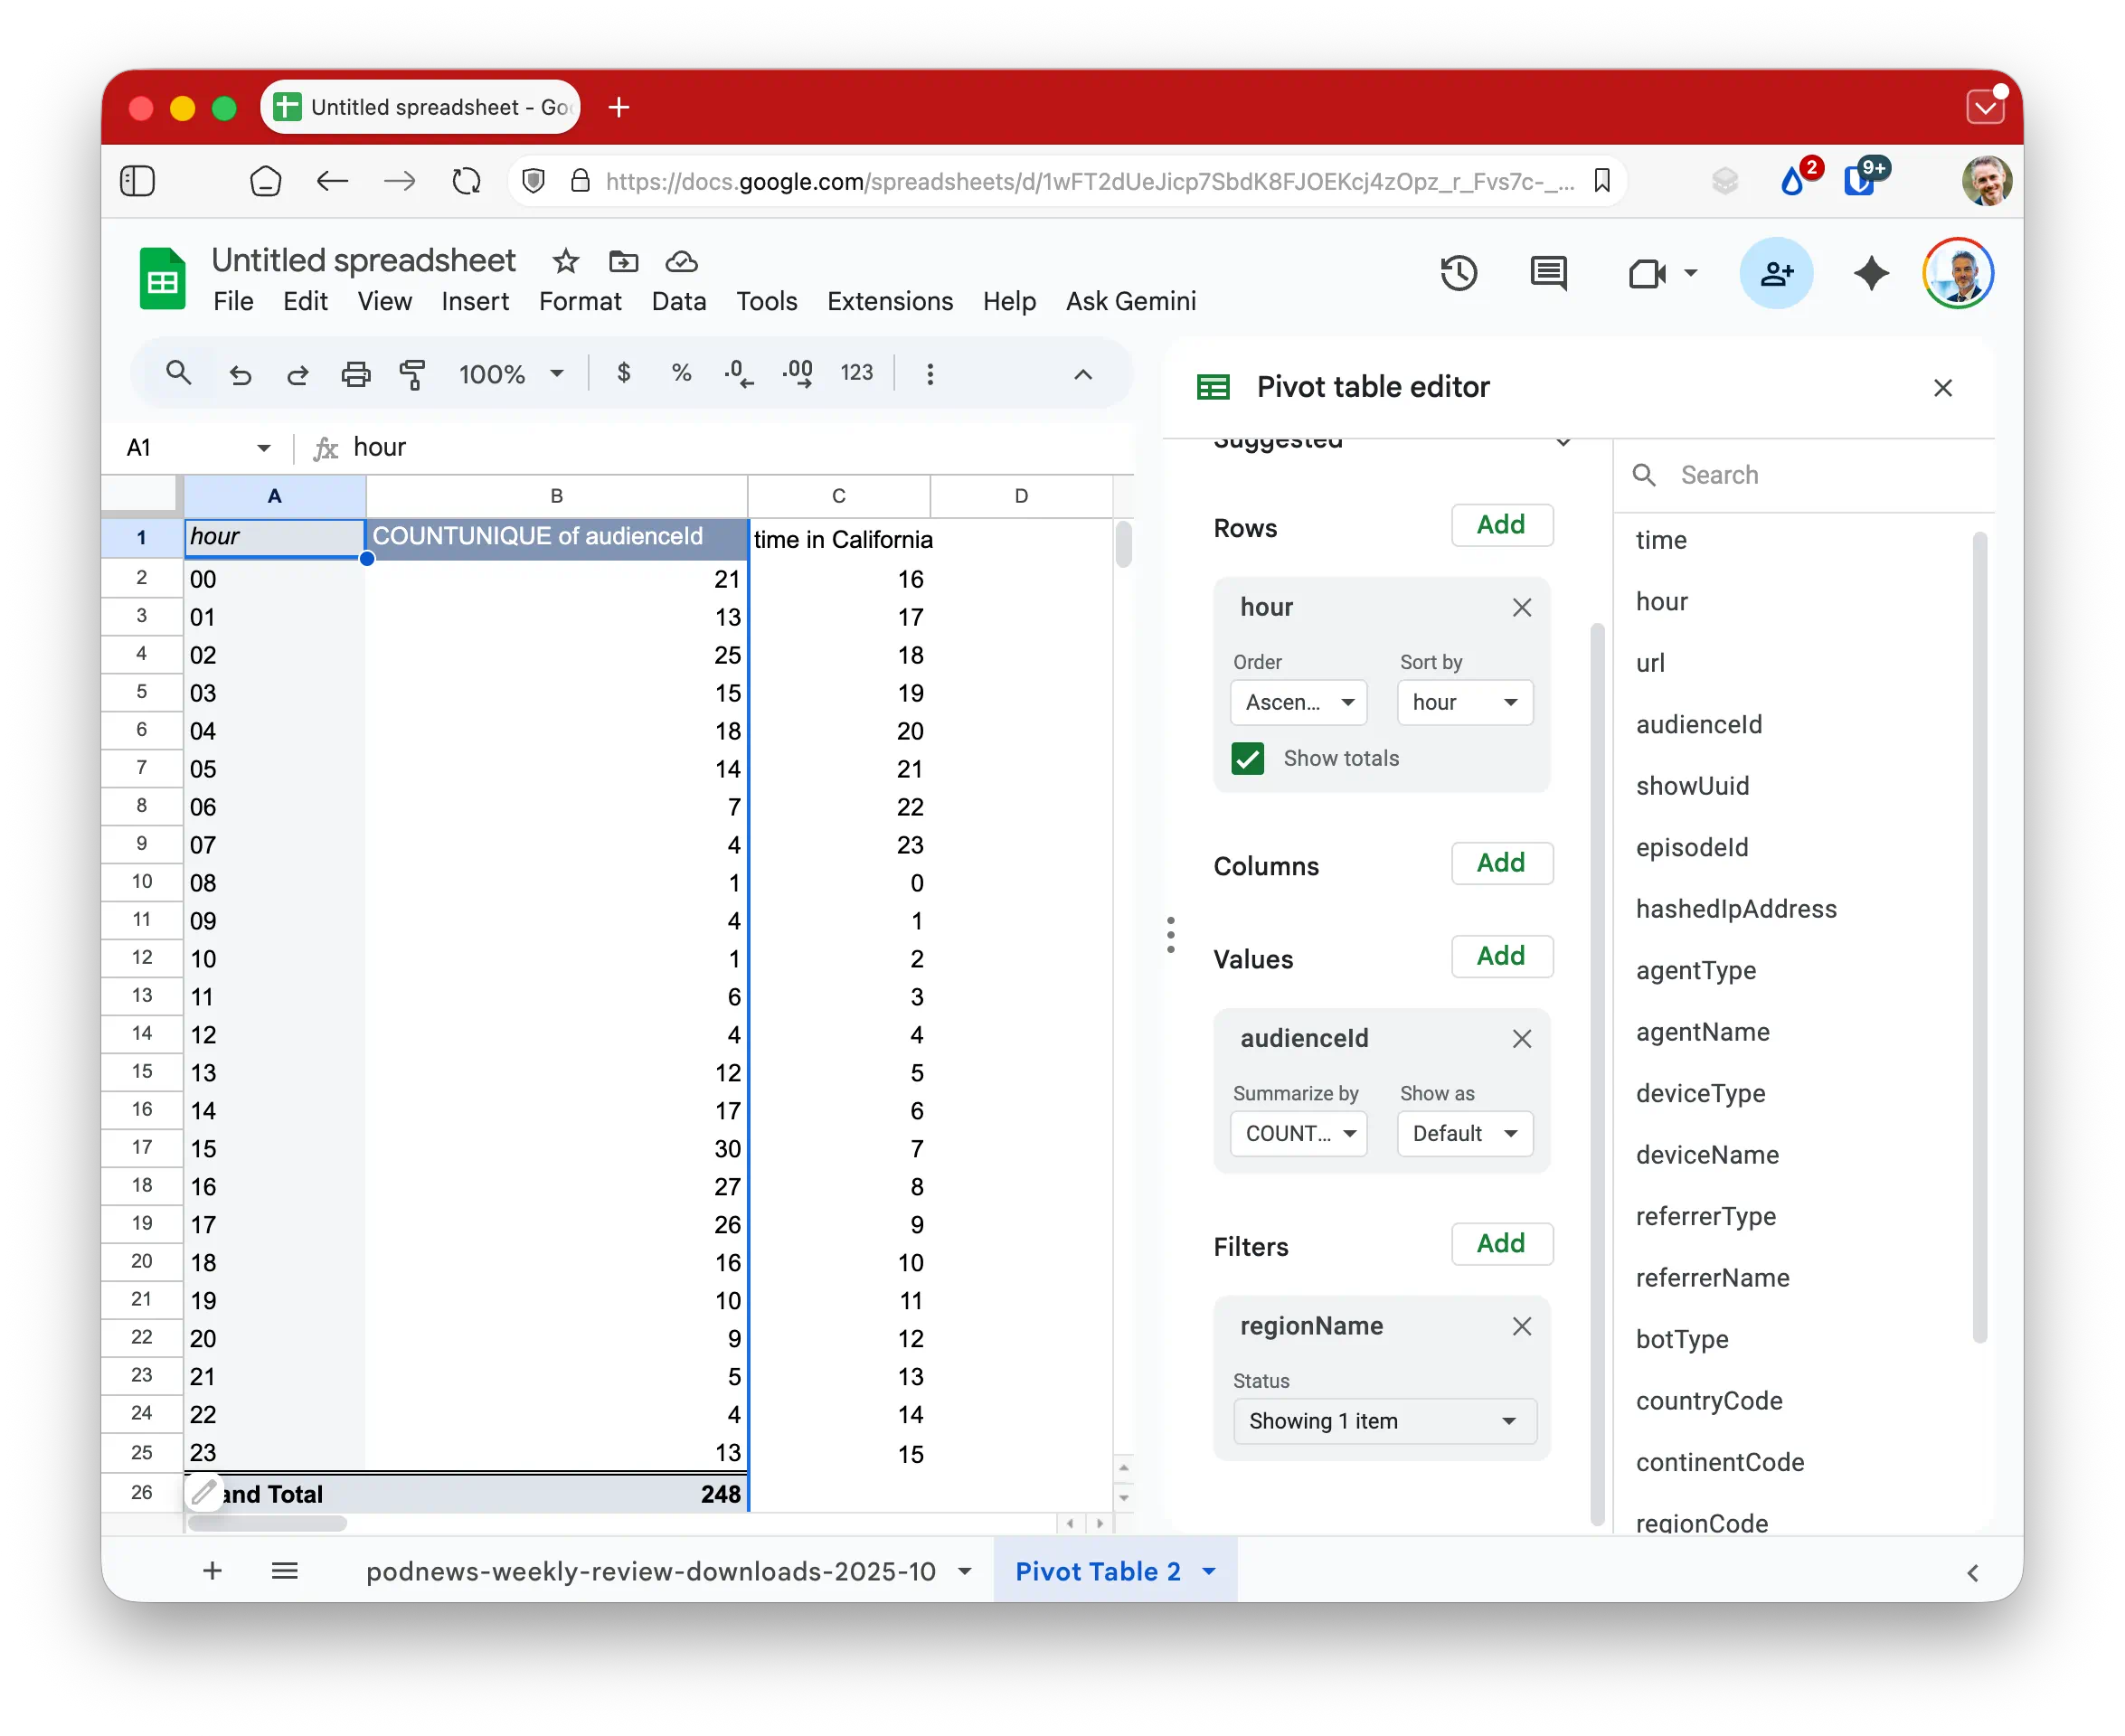
You can see here that there’s a jump in California at about 4pm-7pm (1600-1900 if you don’t read 24 hour clocks), and then another peak at about 7am-10am.
(We normally publish between 4pm-7pm Los Angeles time, incidentally.)
Downloads per listener
While OP3 does a pretty good job of spotting the bots, some bots pretend to be other things, and there’s a limit to any type of bot detection.
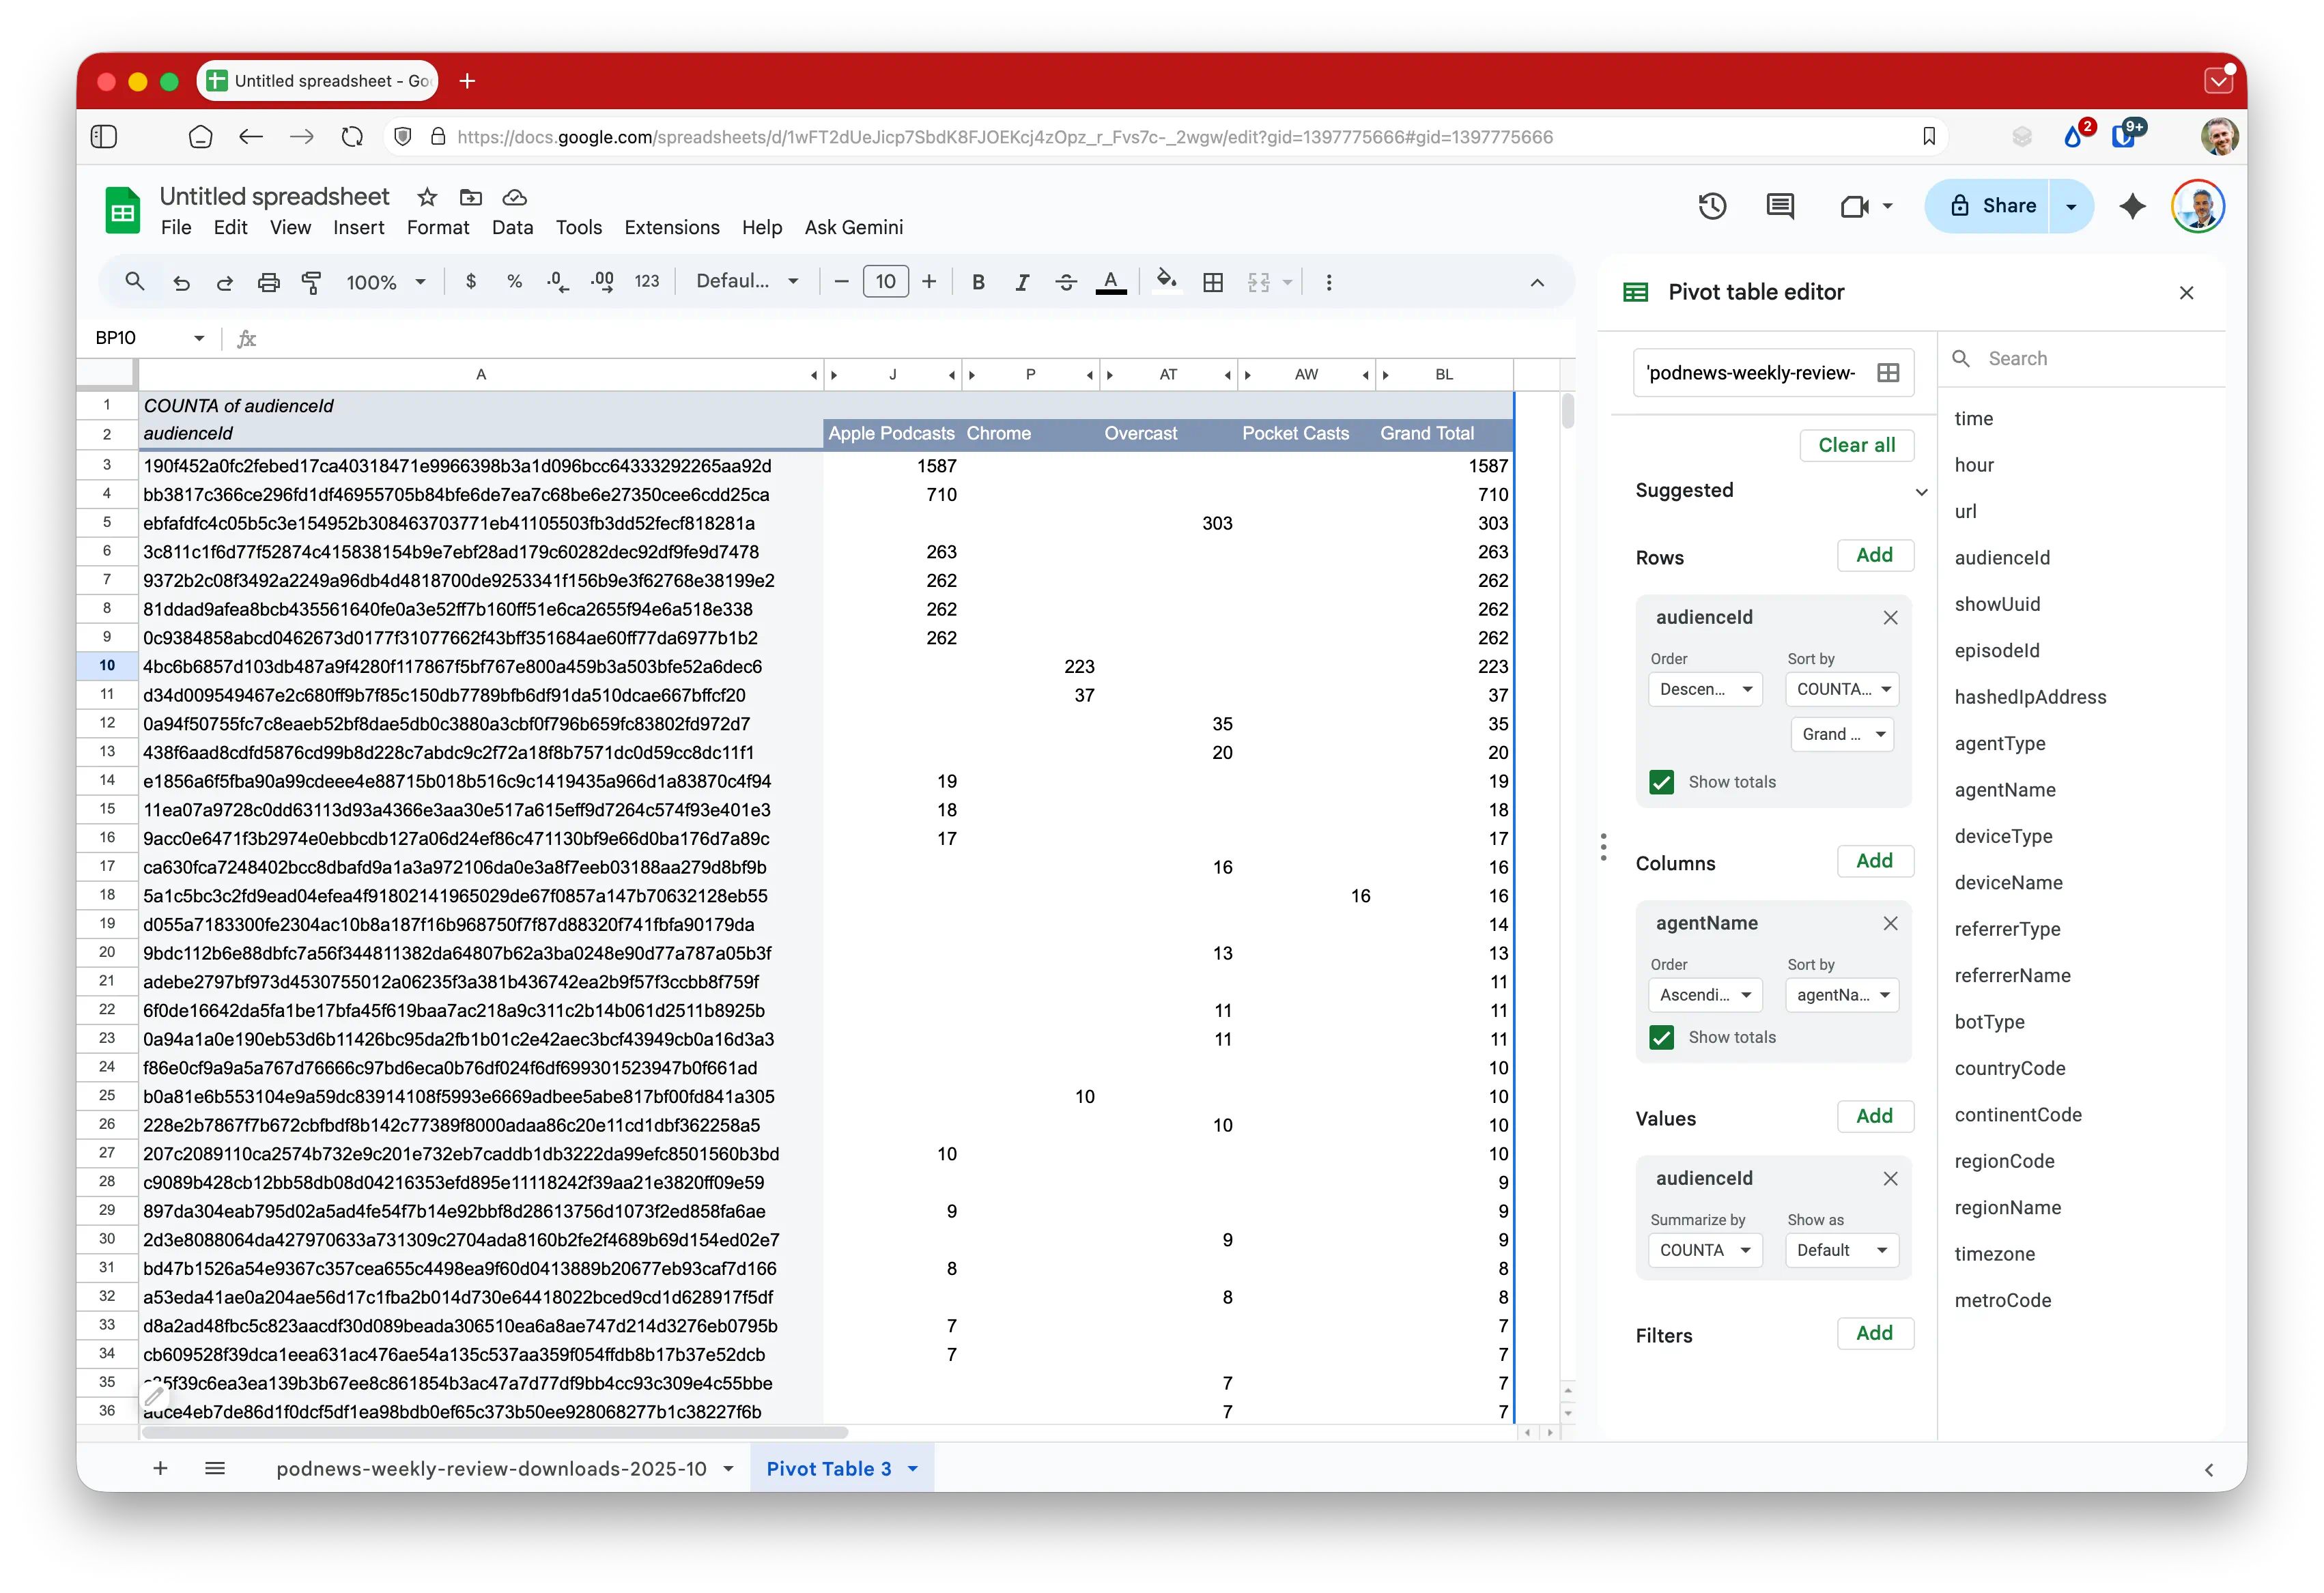
Total number of downloads per audienceID is an interesting thing. We’ve done 262 episodes so far, so… how many people downloaded EVERY episode in October? It turns out seven listeners did. But also that there’s one very dedicated listener who has downloaded (apparently using Apple Podcasts) each episode six times. Assuming they listen to each of the episodes in full each time, that’s 99 days of content they’ve just downloaded there.
You can also see that “Apple Podcasts” seems to be the user-agent that most of these bots use. (I’ve hidden some columns to help this screenshot be visible).
We can’t block these from downloading - OP3 doesn’t keep the IP address for privacy reasons - but it’s always helpful to understand quite what’s going on.
Get your show onto OP3
OP3 is free. Many, many different shows have added themselves to OP3, and it’s pretty easy to add your own show. But once you do, you’ll have access to all this data, and much more.