
A week of podcast data shows Spotify’s dominance

This article is at least a year old
OP3 is a free, open podcast analytics service, used by approaching 2,000 different podcasts.
While it isn’t, yet, of the size that makes it wholly representative of the entire podcast industry - and the type of shows it measures will lean towards independent shows away from the big publishers - I wondered whether we could learn something by looking at a week’s worth of data.
OP3 has an open API, so it’s possible to grab download data for an entire week if you’re patient enough. (As a financial supporter to OP3, I asked nicely for a 2.07GB download instead).
I looked at the full data for 24-30 Apr 2024. This contains “downloads” - which for the purposes of our analysis is defined as a unique download of one episode, to one device, similar to the definitions in the IAB Podcast Measurement Guidelines. This is how OP3 calculates downloads. I’ll remove bots from most of the data collected.
First, some overall numbers, so we know how big the sample is:
24-30 Apr 2024 - overall
3,708,336 total downloads
2,007,789 different devices
1,458 different shows
55,343 different episodes
198,144 downloads were from bots (5.3%)
Types of devices (no bots)
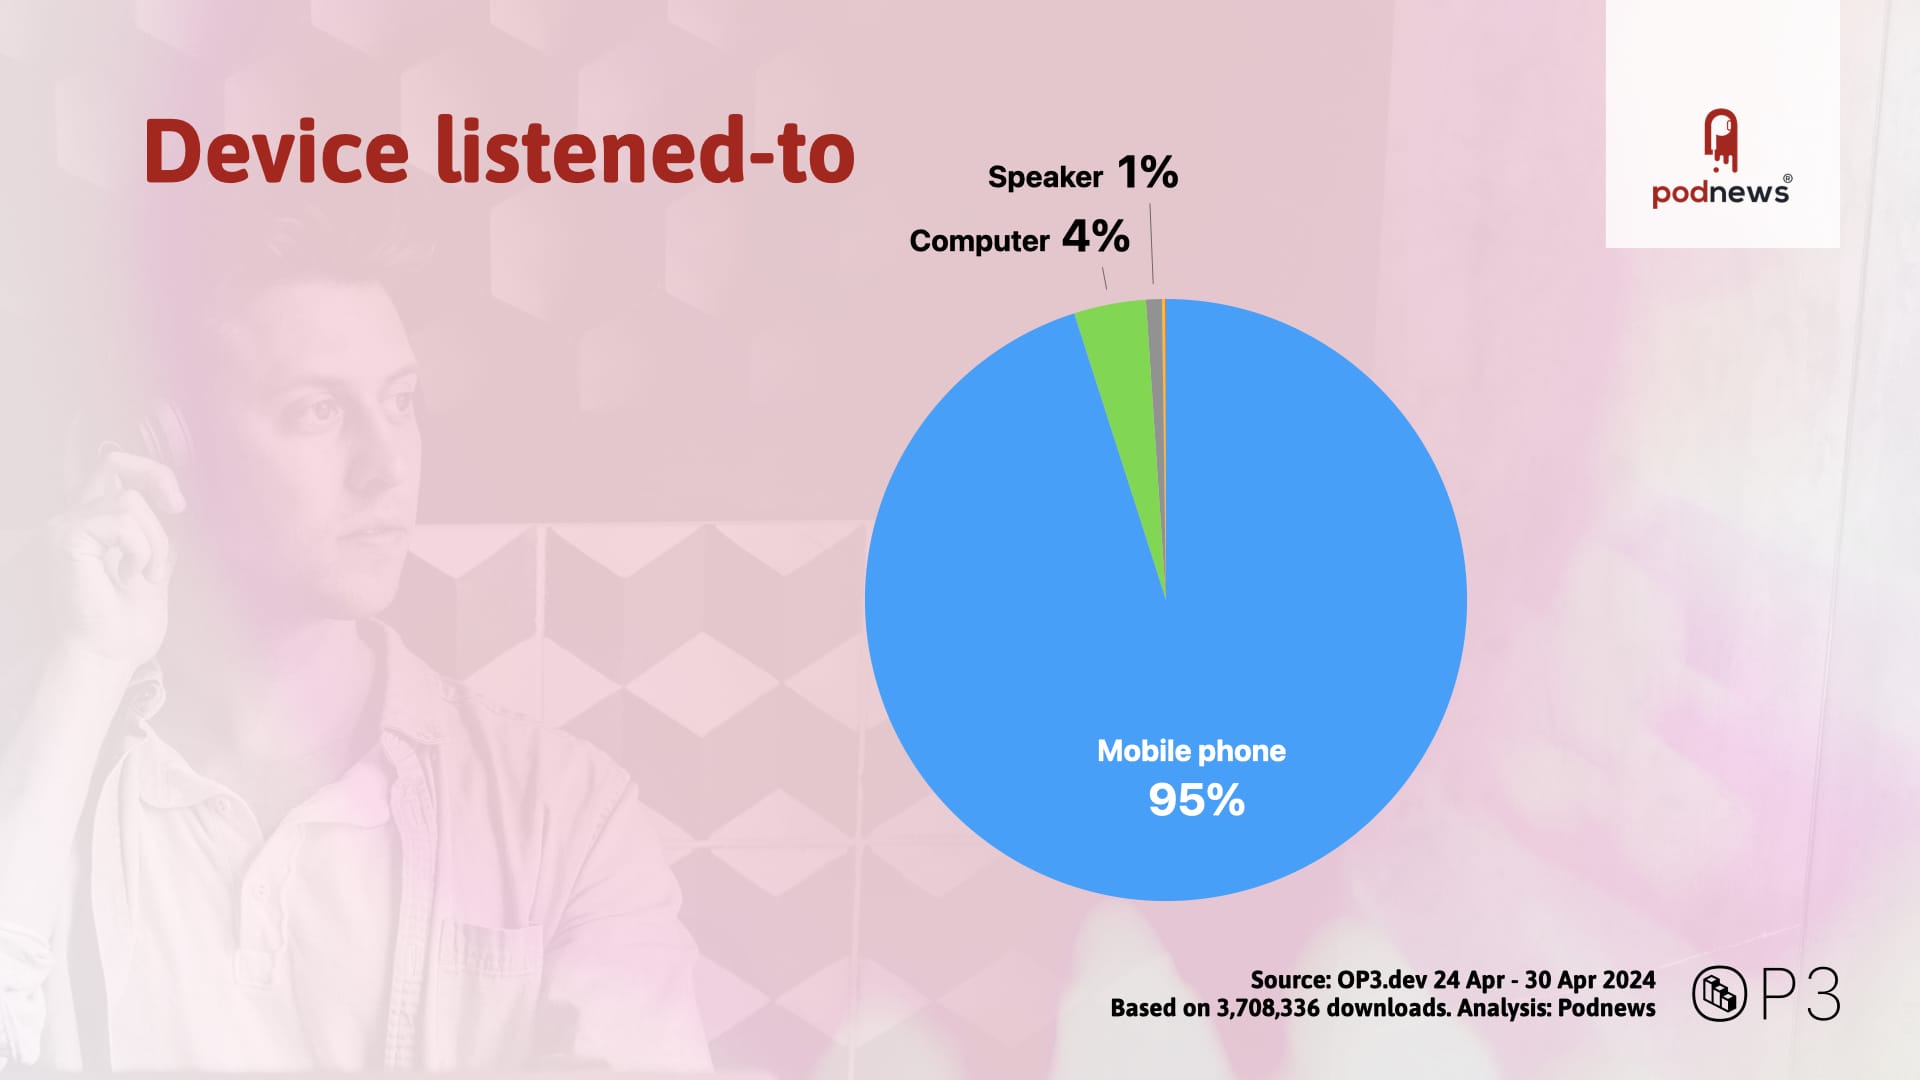
Ask Buzzsprout or Libsyn, both of whom regularly release data like this, and this probably won’t come as much of a surprise. That’s good, because it shows us that our data is relatively sensible.
Device category (no bots)
In case you’re wondering, the majority of these downloads are to Apple phones.
Apple iPhone 56.20%
Android Phone 35.64%
Windows Computer 2.85%
Everything else was below 2%, including iPads, smart speakers and watches.
One take-away from this might be that if you’re advertising something in a podcast, make sure its website works on mobile; and a tablet app is unlikely to be successful for podcasting.
Agent name (no bots)
Again, probably no surprise: the majority of downloads were to Spotify. The difference between Apple and Spotify here is greater than you see in podcast host data: Spotify has 52% all downloads; Apple Podcasts 26%.
So far, so normal. You can see this type of data for Buzzsprout’s platform too. They calculate their player names differently - everyone does - but the results are quite similar.
But, what happens when you start digging in to the data?
The UK
Because I’m presenting to The Podcast Show in the UK, I looked at the UK’s data, and discovered something surprising.
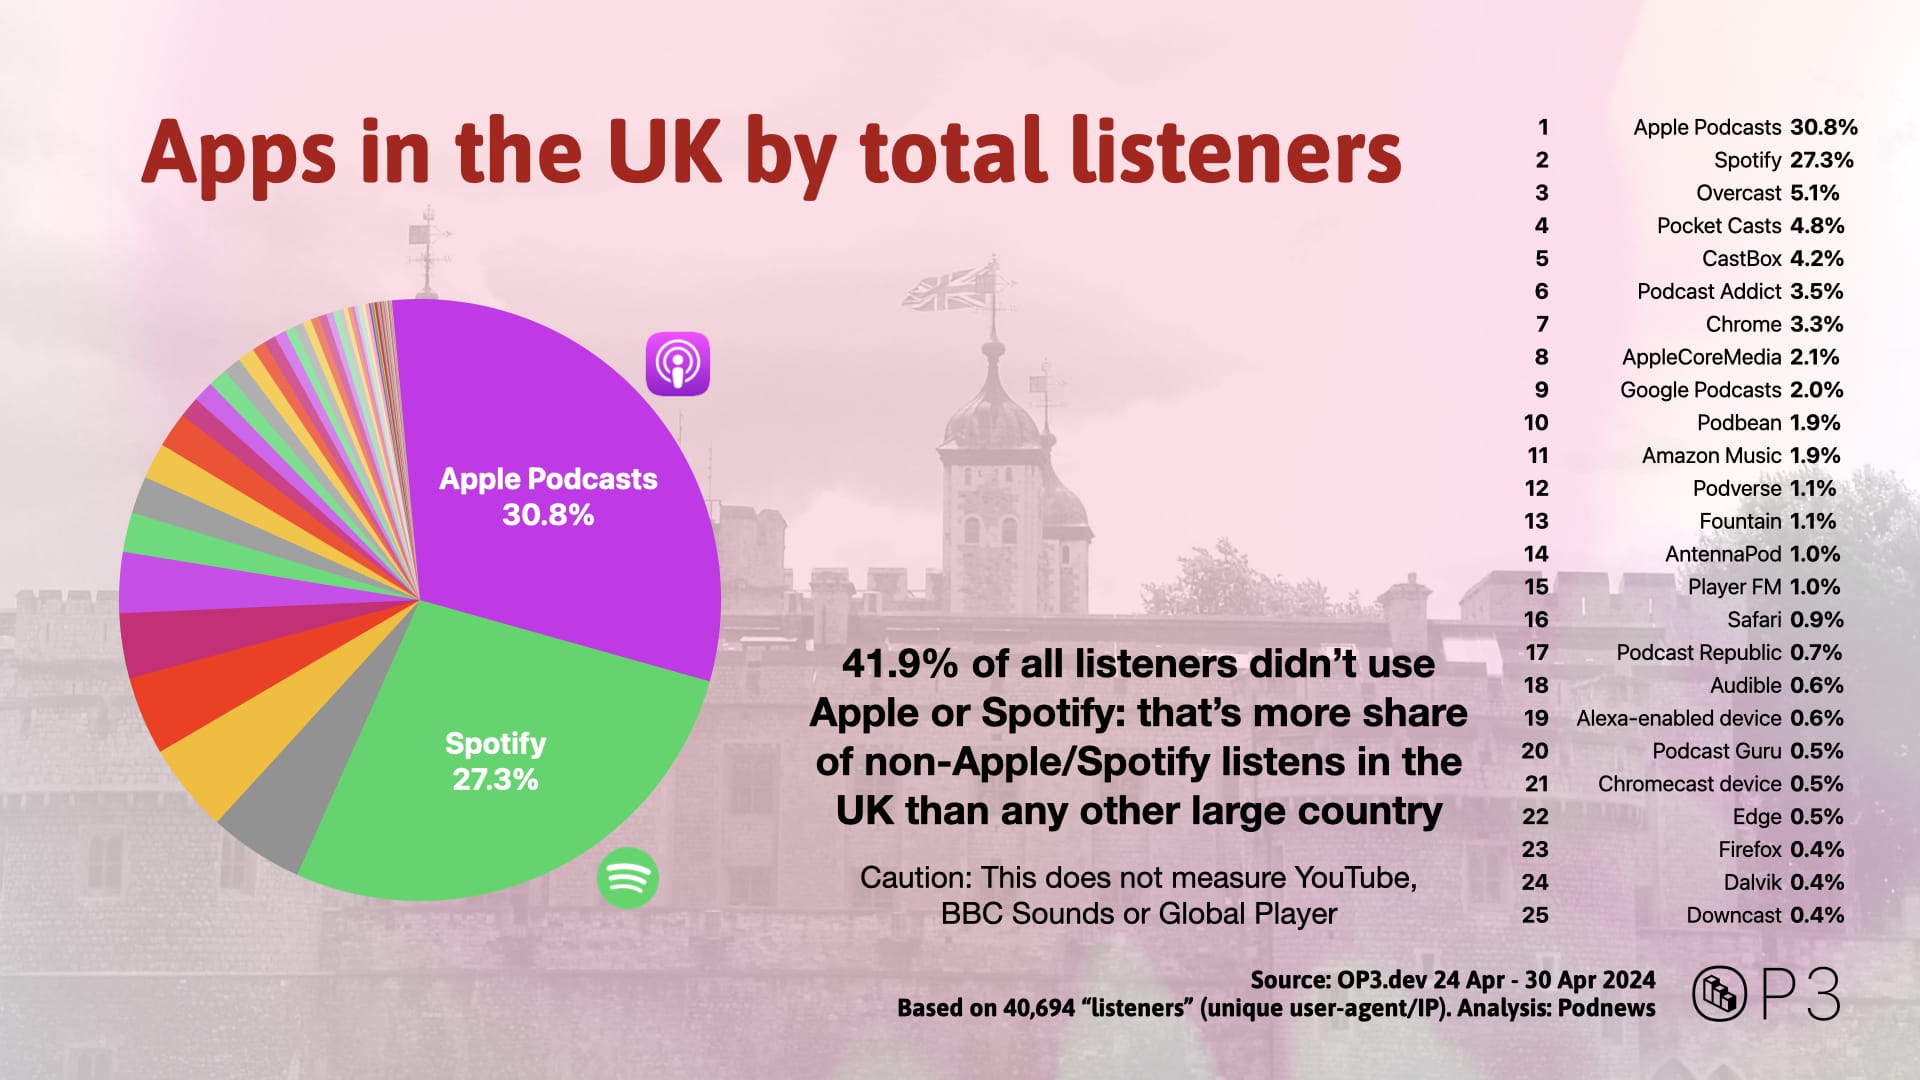
The UK uses more independent podcast apps than any other large country. 42% of all listeners use something that isn’t Apple or Spotify. (This data doesn’t effectively measure YouTube, BBC Sounds or Global Player, either.)
How does this compare with the rest of the world?
Popular apps per country
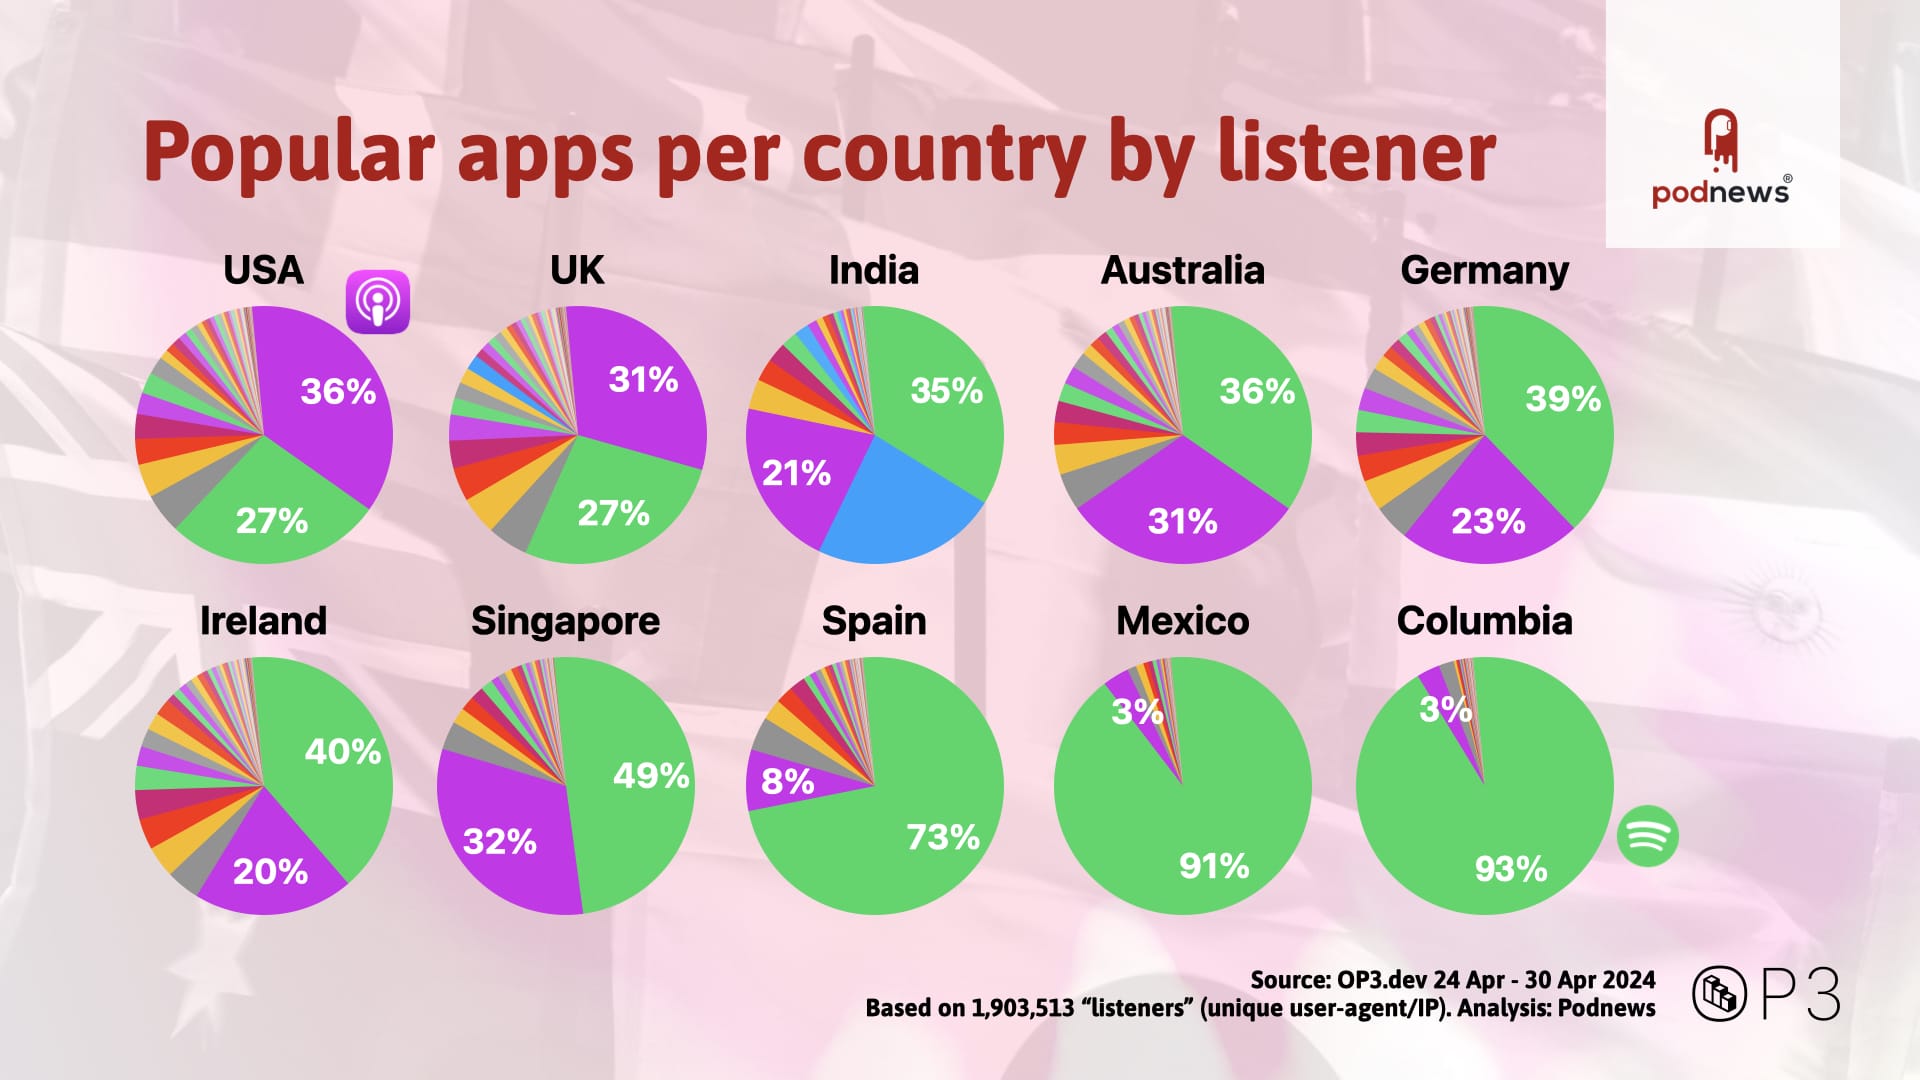
The US and the UK are Apple Podcasts countries; but the OP3 data suggests that, everywhere else, Spotify is the market leader. (This data is “listeners”, rather than “downloads” - Apple has auto-downloads by default, Spotify, by and large, doesn’t.).
Particularly in places like Spain, Mexico or Colombia, Spotify essentially is podcasting. People I’ve spoken to say that Spotify has spent a long time spending time with Spanish-language creators; and a recent visit to Mexico City showed a lot of advertising for Spotify around town.
I wondered whether this was because Android is more popular in these countries. After all, Apple Podcasts isn’t available for Android, and the received wisdom says that Spotify is really only used on Android and not on iOS. And that’s wrong.
Spotify downloads Apple vs Android
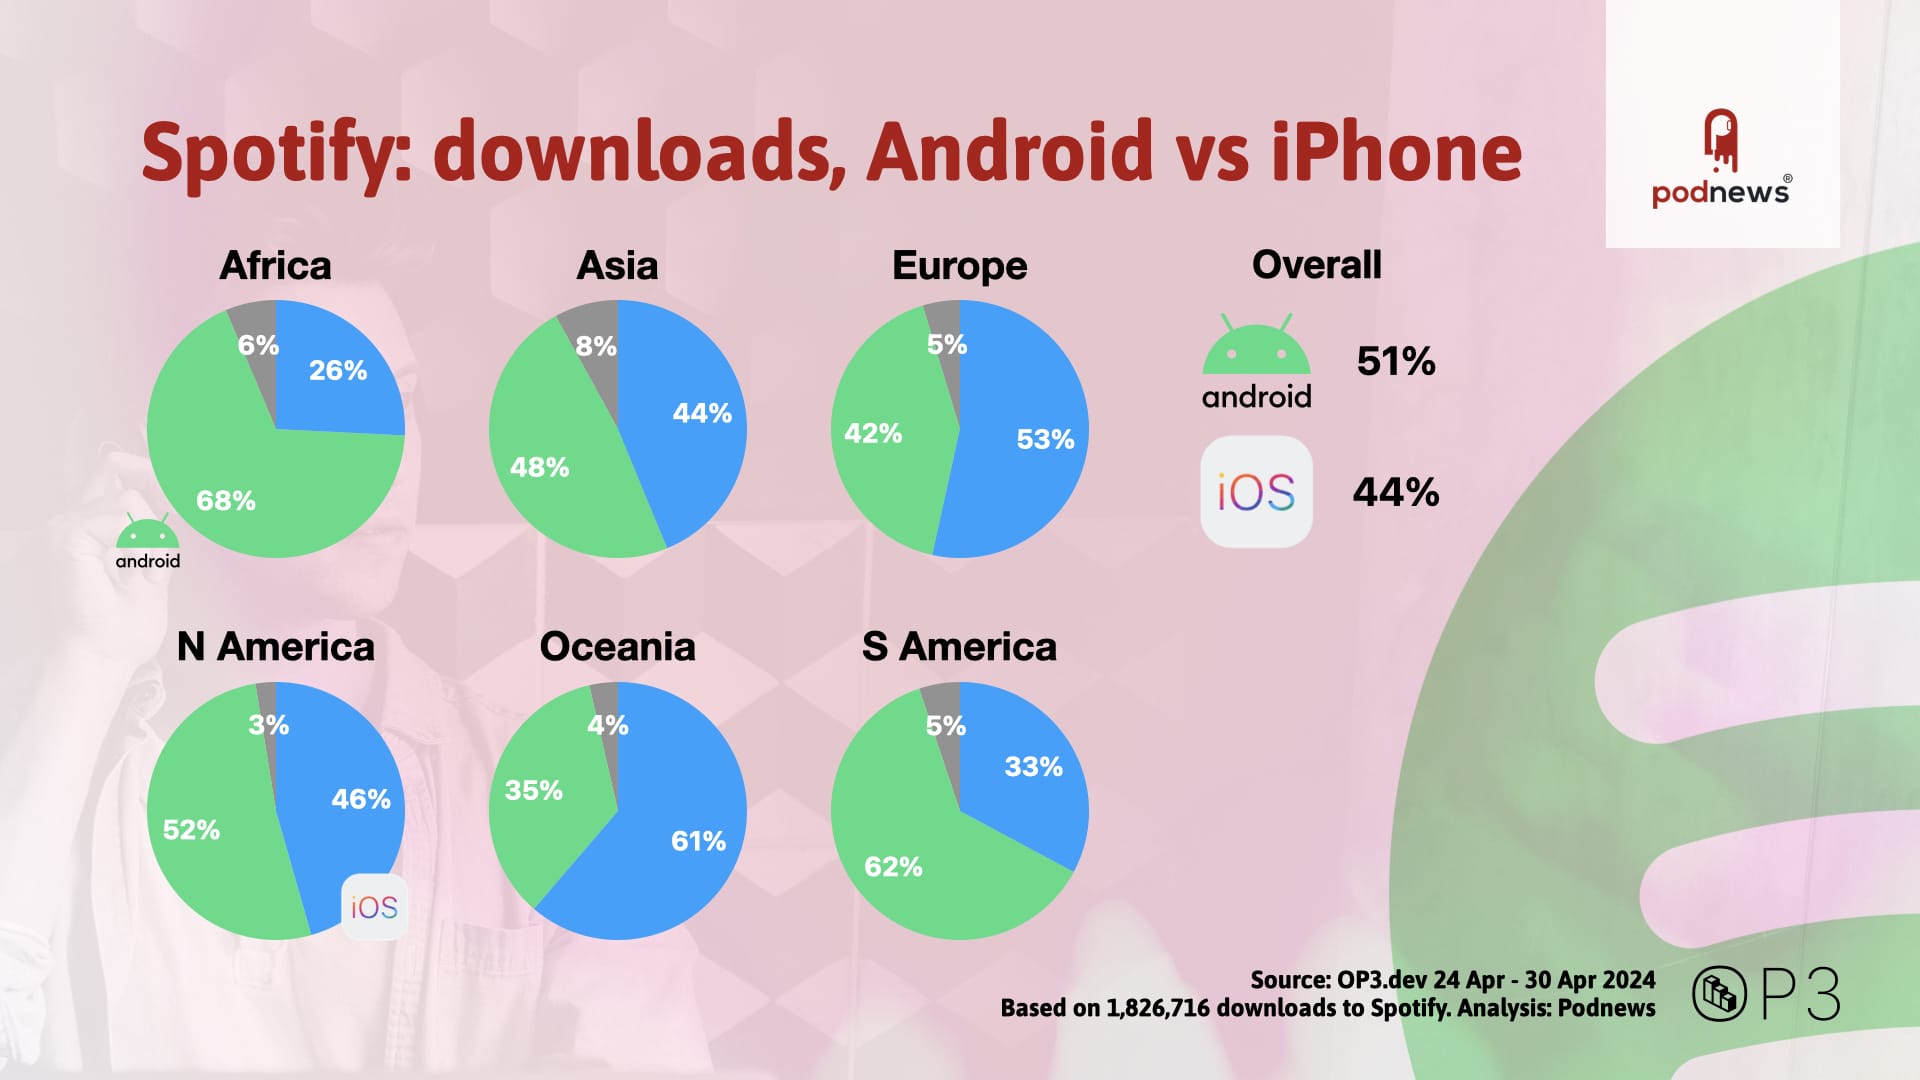
44% of all downloads to Spotify are from iPhones: these are people who have chosen not to use the default-included Apple Podcasts app, and instead have decided to download another app, register on the web, and then use that instead.
The North American figures here are, of course, because Mexico is in North America; but in every continent, there is a significant amount of downloads on Spotify from iPhones. I found this surprising, but also kind of obvious.
Download times
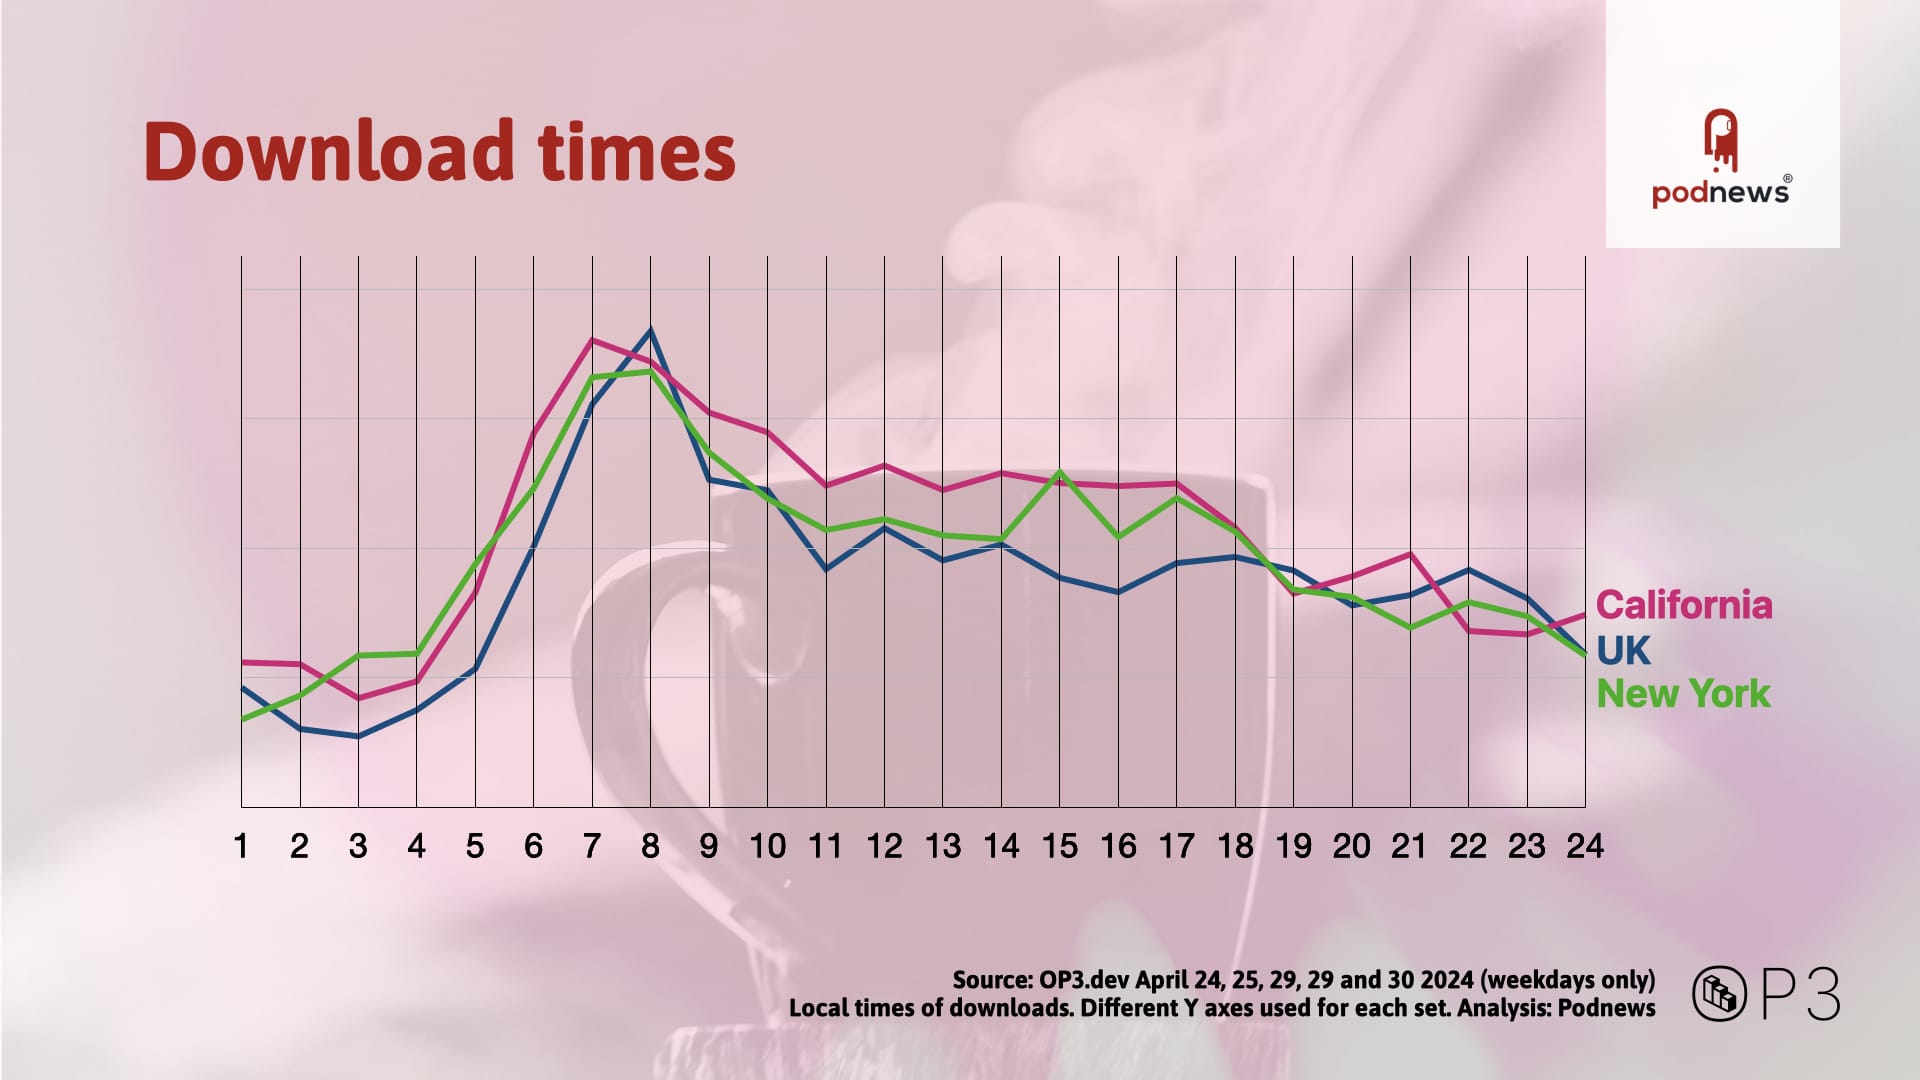
Every download on OP3 comes with the user’s local timezone attached to it; which allows me to work out when people are downloading podcasts. This is probably the limit of the data; but it shows that California (and, incidentally, East Coast Australia) start listening to podcasts earlier than those in New York or London.
Does California wake up earlier than New York? According to every American I’ve spoken to, this is a well-known fact; but interesting to see it here.
Support OP3
This data is clearly useful, and uncovers detail we’ve never seen before. OP3 is free to add your podcast to and to contribute to open podcast data. And, if you’re a company, you might consider financially supporting the OP3 project. (Podnews does).


